23 Potential energy and dynamic height
Consider two surfaces of constant, but different, pressure. From hydrostatic balance, we know that the rate pressure changes with depth is larger in a greater density fluid. Thus, two surfaces of constant pressure will be more closely spaced in the vertical in a denser fluid than in a lighter fluid. This results in constant pressure surfaces (isobars) that are no longer aligned with constant ![]() surfaces. As a result, horizontal variations in density are associated with horizontal pressure gradients, but the relationship is a little more complicated. In fact, as we will show below, horizontal variations of density are linked to how the horizontal pressure gradient changes with depth.
surfaces. As a result, horizontal variations in density are associated with horizontal pressure gradients, but the relationship is a little more complicated. In fact, as we will show below, horizontal variations of density are linked to how the horizontal pressure gradient changes with depth.

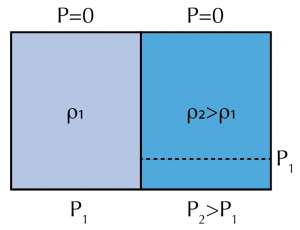
First let’s develop some intuition. Consider two fluid columns of differing density (higher density is on the right in the figure). Assume that the top surface is flat and there is some barrier keeping the fluids in place. The (atmospheric) pressure at the top surface is the same over both fluid columns and the PGF is zero at ![]() . The hydrostatic pressure at the bottom will be greater below the greater density fluid and the PGF is directed toward the left. We can observe two important things:
. The hydrostatic pressure at the bottom will be greater below the greater density fluid and the PGF is directed toward the left. We can observe two important things:
(1) There is a relationship between horizontal density gradients and the difference in PGF at the top versus at the bottom of the fluid, and,
(2) Since the (smaller) pressure value ![]() must be found above the bottom in the right column, the distance between constant pressure surfaces is smaller where density is greater. This corresponds to a smaller difference in gravitational potential energy between the two pressure surfaces
must be found above the bottom in the right column, the distance between constant pressure surfaces is smaller where density is greater. This corresponds to a smaller difference in gravitational potential energy between the two pressure surfaces ![]() and
and ![]() (From your Mechanics course – the gravitational potential energy of an object is
(From your Mechanics course – the gravitational potential energy of an object is ![]() , the gravitational constant times its altitude, if we divide by the mass.)
, the gravitational constant times its altitude, if we divide by the mass.)
Now let’s work out the math. Starting with the hydrostatic pressure gradient
![]()
and remembering that the partial derivative is just a ratio of small changes in pressure (dP) and depth (dz) while holding time and the horizontal coordinates constant, we find
![]()
Since g is effectively a constant over the depth of the ocean, the left side represents the difference in potential energy between two points in a water column, separated by a small vertical distance. We can easily measure the variables on the right side with a CTD, one of the most abundant forms of data we collect about the interior of the ocean.
For real-world vertical distances, we add up all the small changes in potential energy, or integrate the last expression.
![]()
Key Takeaways
We call this difference in geopotential (![]() ) between two points in the water column the dynamic height, D:
) between two points in the water column the dynamic height, D:
![]()
If you are not comfortable with integration, we simplify in the last step by thinking of the dynamic height as minus one times the pressure difference, ![]() , divided by the average density within that part of the water column,
, divided by the average density within that part of the water column,
![]()
For example, take Point 2 to be above Point 1 (![]() ). Then,
). Then, ![]() will be a negative number, and the dynamic height will be a positive number. It will be a larger number (for the same pressure interval) when the average density is lower.
will be a negative number, and the dynamic height will be a positive number. It will be a larger number (for the same pressure interval) when the average density is lower.
Horizontal gradients in dynamic height can be shown (derivation) to be related to the horizontal pressure gradient force at one level minus the horizontal pressure gradient force at a deeper level.
For example, for the x-component:
![]()
This relationship to hydrostatic pressure gradients is very convenient since we can easily measure dynamic height. We will return to this topic in a later section.
Mini-lecture for class:
Media Attributions
- DynHeight © Susan Hautala is licensed under a CC BY-NC-SA (Attribution NonCommercial ShareAlike) license

