
Carbon Nations: Sources of Carbon Dioxide
“Carbon dioxide. They call it pollution. We call it life.” That’s the words of the Competitive Enterprise Institute’s fossil-fuel-funded ad campaign that ran in U.S. markets in 2006. The political climate of the United States was a rising skepticism about environmental policy. George W. Bush was president, and would eventually declare his intention to leave the Kyoto Protocol, in part because of the constant lobbying from disinformation groups such as the CEI.
A fossil fuel ad from 1962, this one from the company that eventually became Exxon/Mobil reads “Each day Humble Energy supplies enough energy to melt 7 million tons of glacier!” The pride taken in the company of what has become a crisis of melting ice and sea level rise is ironic for sure, but let’s consider the numbers.
The heat-trapping effect of the carbon dioxide released in combustion of fossil fuels used for heating exceeds the direct heating effect after just 2 months. After a pulse of carbon dioxide emissions, there is quick uptake by the surface ocean, and a longer uptake by the land and deeper oceans, there still remains a large fraction of the original pulse in the air, even after thousands of years. All in all, over its lifetime, the carbon dioxide ends up trapping about 100,000 times as much energy via the heat-trapping effect as it does from that initial direct heating. So imagine instead 700 billion tons of glacier per day, eventually melted, as the true statistic behind the ad. Currently Exxon is up to 79 million tons of glacier-melting capacity per day in terms of direct heating, or 8 trillion tons eventually melted from a day of pollution. The oil industry as a whole sits at 1.9 billion tons per day of direct melting, or 200 trillion tons eventually.
From these statistics it should be immediately evident that carbon dioxide is indeed a pollutant, affecting the entire world via its heat-trapping effect. The extremely long lifetime is additionally enhanced by the fact that carbon dioxide emissions are tremendous, more than any other pollution source. Every fifteen minutes, a million tonnes of CO2 are emitted.
Data from Global Carbon Budget 2024.
Land use change was a bigger contributor to carbon dioxide emissions than fossil fuels up until 1950. Fossil fuels and industry carbon emissions have quintupled since then; while land use emissions are similar. Land use changes result from a difference between emissions from deforestation and an uptake from abandoned agricultural land. It is difficult to estimate the carbon emissions from each of these processes, resulting in uncertainty on the order of +/- 50% for land use carbon emissions.
Data from Global Carbon Budget 2024.
Each of the three fossil fuels contribute a large percentage of carbon dioxide emissions. Nearly 8 billion tons of coal are burned each year, mostly either for electricity or in industry. It takes about a pound of coal (0.5 kg) to generate 1 kilowatt-hour of electricity. A typical power plant burns around 10,000 tons of coal each day.
Around 1.5 trillion gallons (5.8 trillion liters, or 5 billion tons) of crude oil are extracted each year, and used mostly for transportation. A gallon of gasoline weighs about 6 pounds, but creates 20 pounds (9 kg) of CO2, because the carbon in the gas combines with oxygen from the air.
Fossil methane gas, marketed by the fossil fuel industry as “natural gas,” is used primarily for electricity and heating. It’s typically around 95% methane, with ethane (C2H6) making up much of the rest. We use around 4 trillion cubic meters of methane gas each year, equivalent to 2.8 billion tons.
Cement production is another source of CO2. It results from the decomposition of limestone into lime when heated.
The image below shows the full carbon cycle from the last 10 years as estimated by the Global Carbon Project.
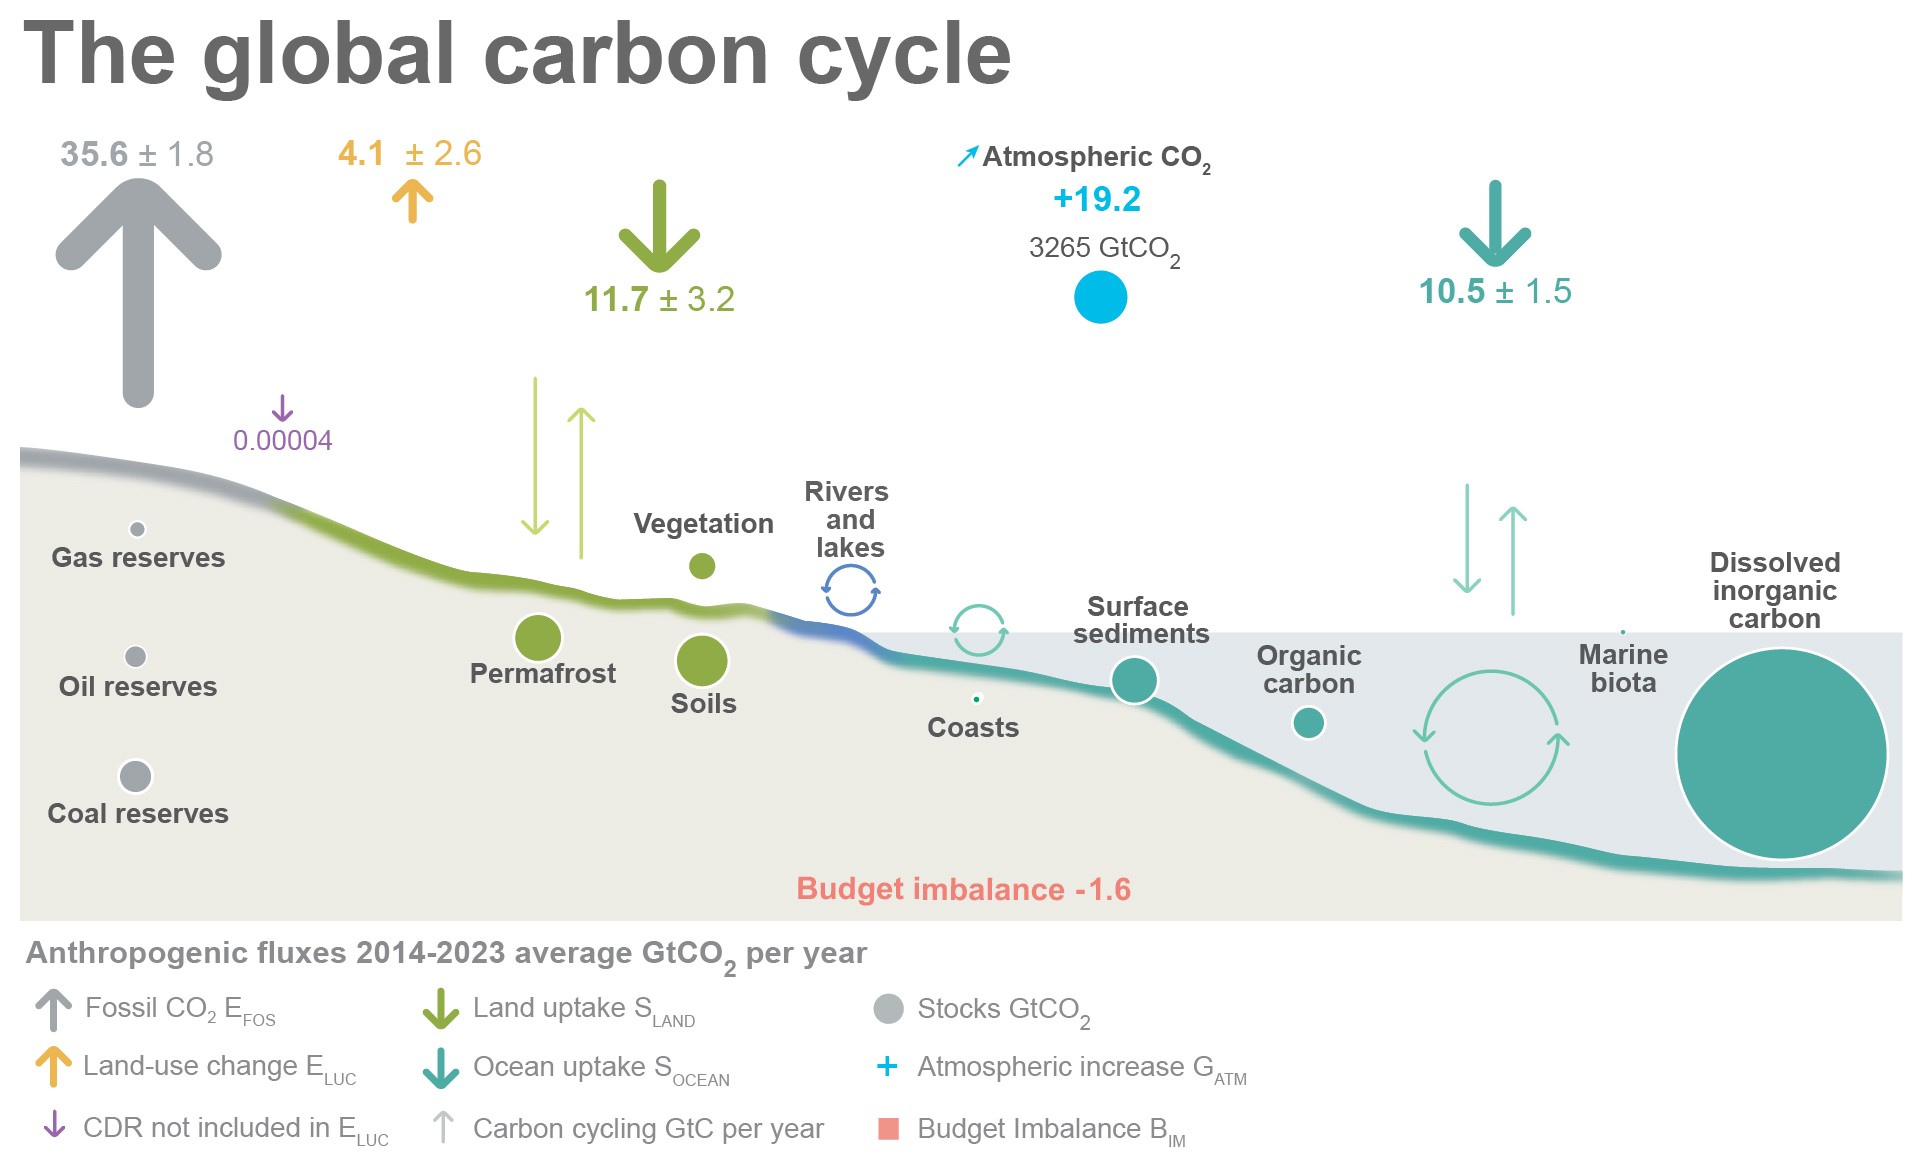
Used with permission of the Global Carbon Project under the Creative Commons Attribution 4.0 International license.
Methane gas reserves are estimated to be between 1410-4170 GtCO2, oil reserves are estimated to be between 640-970 GtCO2, and coal reserves are estimated to be between 1630-1980 GtCO2. There are uncertainties in this data of course, but if you take the numbers at face value, they can be used to estimate the number of years left of each fossil fuel, if emissions were to stay the same as today. This calculation suggests there is between 120-145 years of coal, 55-85 years of oil, and 190-560 years of methane gas. Or calulating with the sum of the three fossil reserves, the minimum estimate of 3700 GtCO2 could sustain the emissions of today for over 100 more years, the maximum could sustain current emissions for 200 years. This is why, in the words of Nigerian climate activist and poet Nnimmo Bassey, we have to “leave crude oil in the soil, coal in the hole, and tar sands in the lands.”
Airborne fraction is defined as the amount of CO2 that sticks around in the air, instead of going into the ocean or land. The atmospheric increase is noisy! Any rate of change is noisy if estimated from imperfect time series data (the time derivative increases variability at short time scales). Much of the variability is real though; during strong El Nino events, increases in forest fires lead to more carbon released into the atmosphere and a higher airborne fraction.
The large variability of the land sink in particular can be seen in this GCP plot.
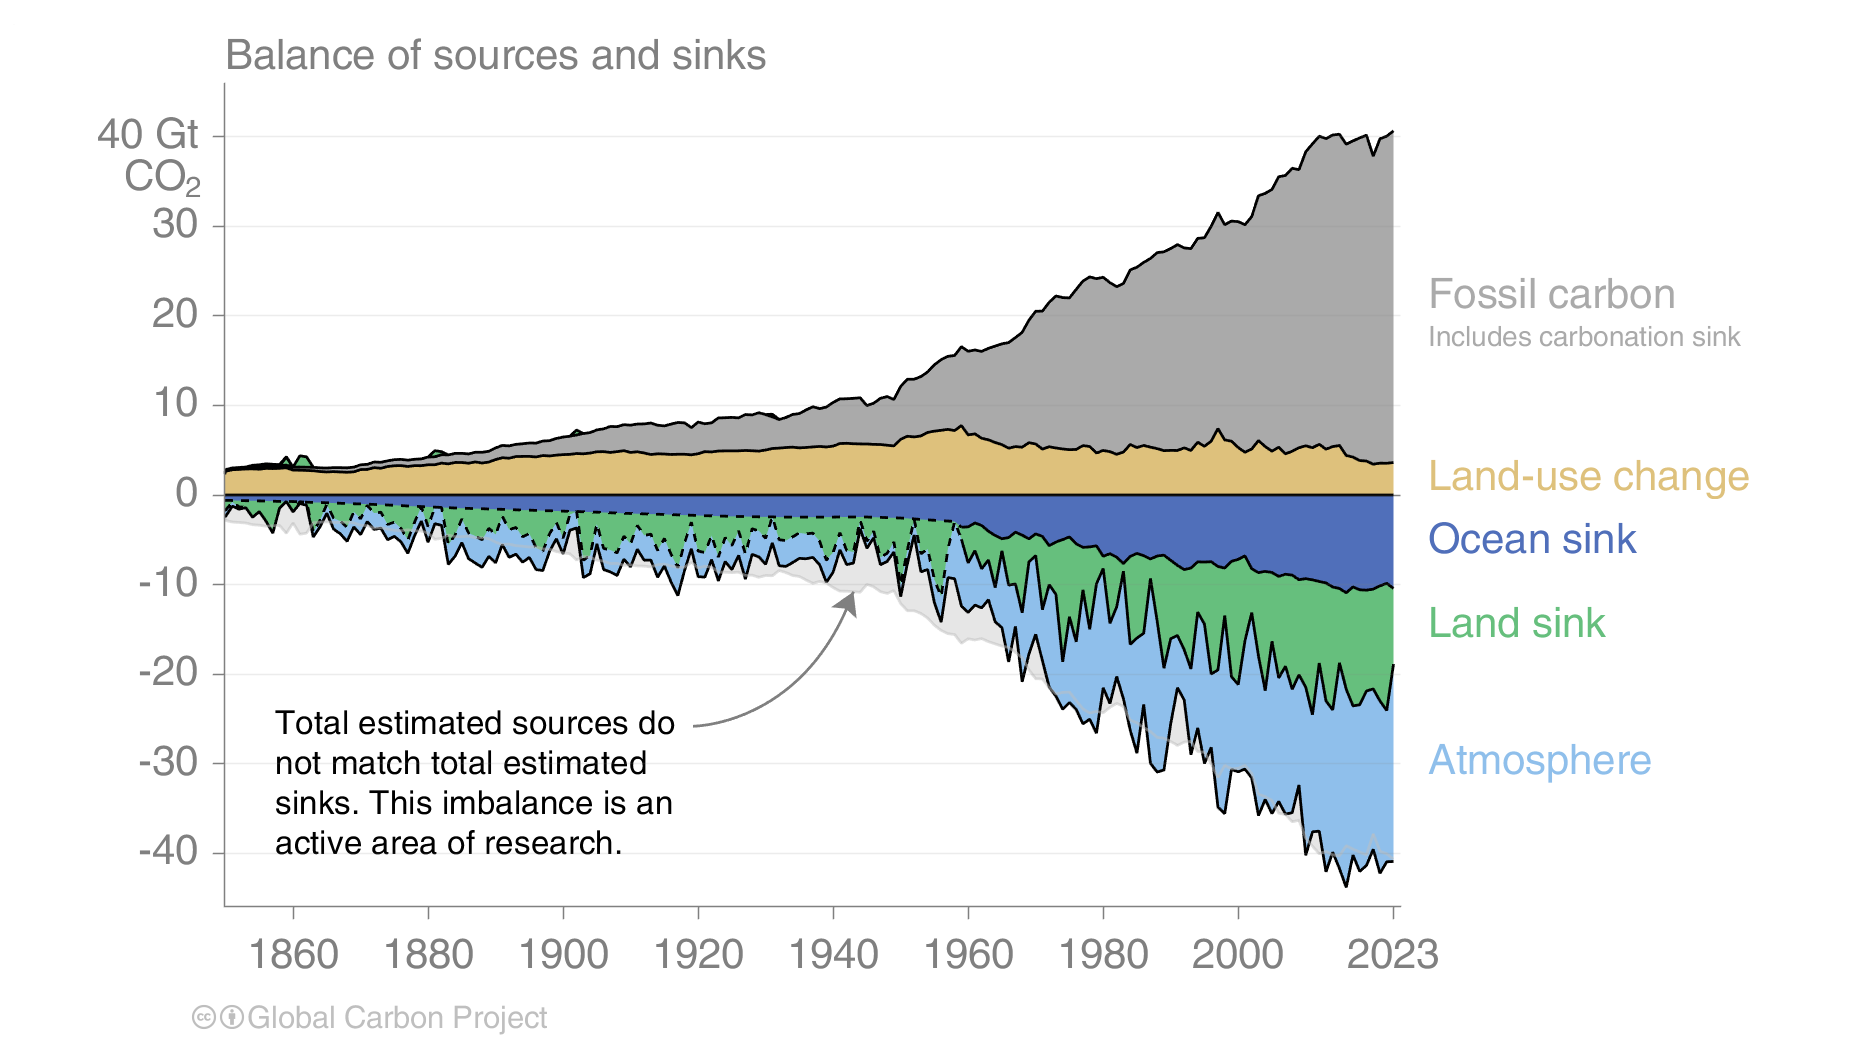
Used with permission of the Global Carbon Project under the Creative Commons Attribution 4.0 International license.
Fossil CO2 emissions data from IEA-EDGAR, and deforestation (land use change) data from the Global Carbon Budget 2024.
Sector by sector emissions data is available since 1970. It’s important to point out, however, that these are not as separate as one might expect from the figures. For instance, “buildings” includes only combustion of fossil fuels within residential or commercial buildings, which is mostly used for heating. There is a large amount of electricity usage within buildings, but the carbon emissions for that is categorized as electricity.
Electricity emissions have increased steadily since 1970, by a factor of 3.8 from 1970 to 2018. Industrial emissions (including the fossil fuel industry) have doubled since 1970, with particularly large increases since the globalization of trade in the early 2000s. Emissions from manufacturing and construction are the largest source, as can be seen in the plot below.
Source: IEA-EDGAR.
The emissions from transportation have nearly tripled since 1970, and remain about 80% from road transportation.
Source: IEA-EDGAR.
Emissions within buildings have increased by 20% since 1970. Much of this is due to methane gas for heating. Buildings, of course, use a lot of electricity as well, but this goes into the electricity calculation in the above plots.
Connect
Follow Nigerian climate justice advocate Nnimmo Bassey on social media.
- Watch, listen or read an interview of Nnimmo Bassey with Ruth Nyambura, in which they discuss COVID-19 in Africa, neocolonialism, and false solutions to environmental problems.
- Read an interview with Nnimmo about some recent legal victories over Shell Oil.
- Watch media featuring Bassey, including The End of Oil, Explained and A Message from the Future II: The Years of Repair.
