
Dark Side of the Earth
Ever dream of floating through space and watching the light of a new day dawn across planet Earth? It’s thrilling to imagine the Sun’s radiant warmth casting across our planet, bisecting the world into day and night.
The most geometrically well-organized days are those perfect 24 hours of equinox around March 20 and September 23 each year, when the Earth’s tilt is aligned so that everywhere on the planet experiences exactly 12 hours of day and night. The axis of rotation is exactly perpendicular to the orbital plane on those days. It’s sunrise at one pole, and sunset at the other.
During the solstices (around June 21 and December 21 each year), the Earth is maximally tilted at an angle of 23.4 degrees towards the Sun on one pole, and away on the other pole. In the December solstice, perpetual darkness envelops the polar regions in the Arctic hemisphere, while anywhere poleward of the Antarctic Circle experiences perpetual day. In the June solstice, the Arctic experiences 24 hour lightness and the Antarctic is in darkness. These geometrically determined dates are the most universally shared holidays on Earth, and are celebrated with festivals or commemorations in a variety of cultures.
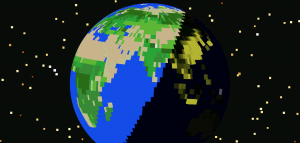
You can play the interactive visualization Dark Side of the Earth by EarthGames student Alexey Beall to explore how the length of day changes with the seasons in different locations on Earth. It’s particularly fun to interact with on iPad or iPhones, but is also available for PC/Mac in browser. Everything in the app is based on real scientific data: geometric calculations are performed to give the diurnal and seasonal cycle of sunlight throughout the year. Elevation, land cover, and population data determine the colors of the Earth during day and night, and real star charts are shown in the background.
Tilt of the Earth changes quite slowly, but is gradually decreasing. 8000 years ago the tilt was 24.2 degrees, and summers and winters were each more intense. In 10,000 years, the obliquity will be only 22.5 degrees.
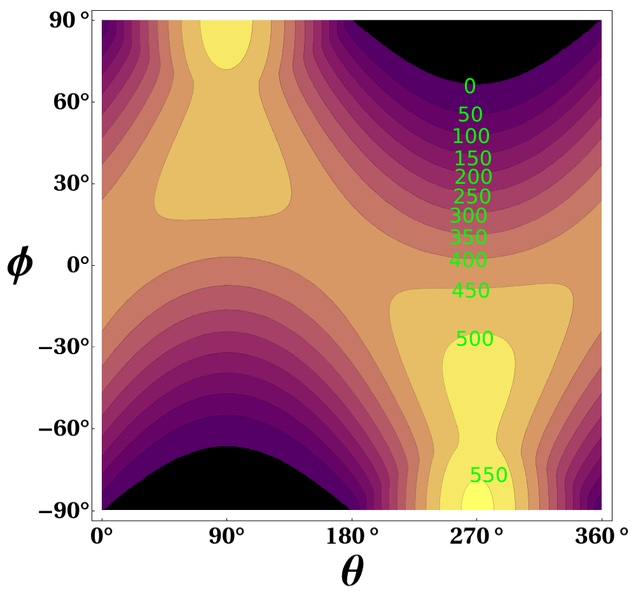
The tilt of the Earth doesn’t just determine the length of the day. It also determines the solar power that is incident on the planet at different times of the year. Both the length of the day and the directness of the sunlight matter for how much sunlight is incident onto the Earth. At top of atmosphere, the incident sunlight as a function of latitude and angle of the Earth’s orbit around the Sun (starting from equinox at theta = 0) is plotted below.
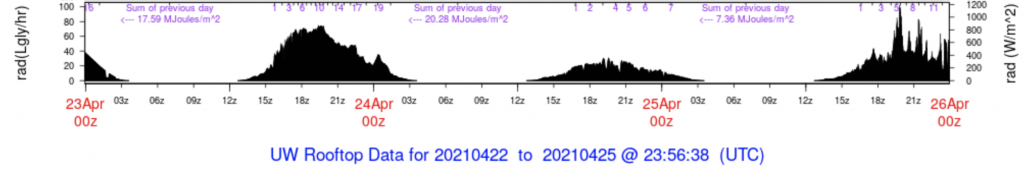
Then there’s cloudiness. It might be surprising how much sunlight is still coming down even on those gray days. Direct radiation characterizes sunlight on a sunny day. Cloudy days have what is called diffuse radiation. Sunlight bounces off of liquid droplets or ice crystals within clouds and scatters the photons all around. Some gets bounced back to space, but some is just redirected a little, and heads down towards the surface at a different angle. When you see whiteness or gray in a cloudy sky, it’s just photons that have bounced off of cloud particles coming from that direction. Diffuse light can still be used, for photovoltaic power, solar thermal power, or passive solar.
An example of the daily sunlight on a rainy April day in Seattle is shown below. The second full day in the time series had peak radiation of less than 400 W/m2, less than half of the sunny periods of the surrounding days. All in all, the rainy day totaled an average of 85 W/m2 when averaged from midnight to midnight. This is less than half of the surrounding days and less than one-third of the sunny days from the prior week in Seattle, shown as examples in the previous chapter.
The effect of both cloudiness and seasonal sun angle around the world can be seen below in plots of PVOUT in June and December. PVOUT is the average energy that can be generated by 1 kW of nameplate capacity with the ideal annual mean tilt. Increments of 1.2 kWh/kWp represent 5% capacity factor increments.
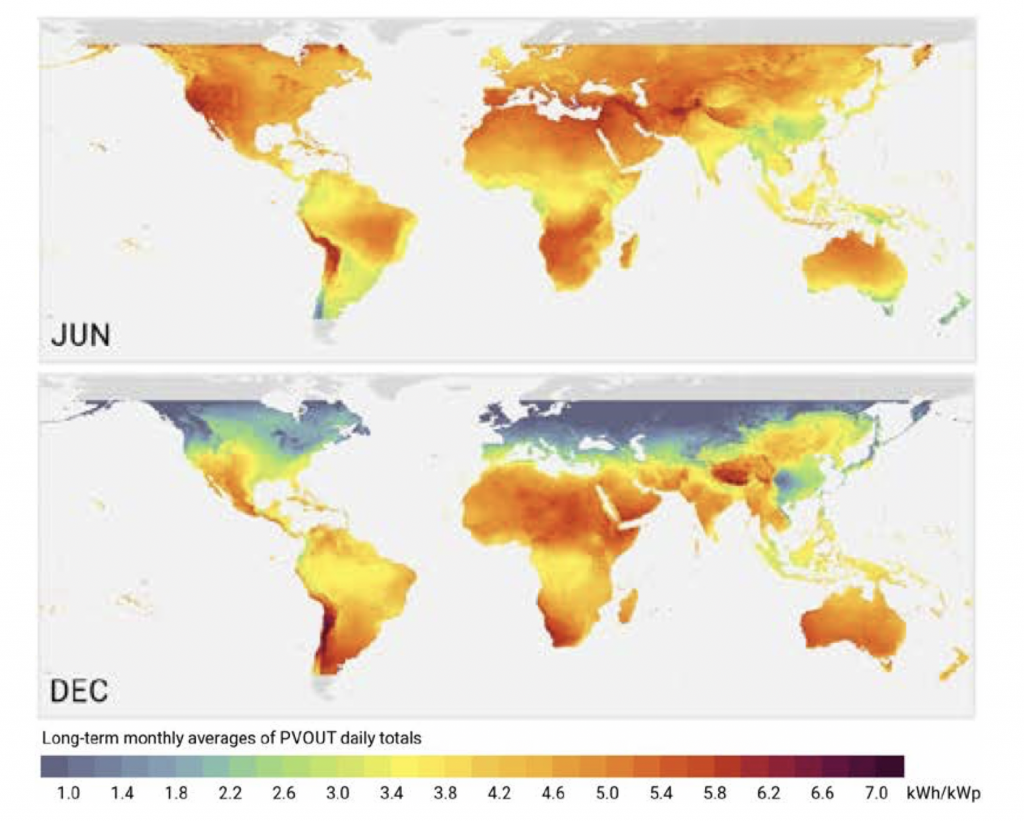
From Solargis.
In the high latitudes of the Northern Hemisphere, the solar power potential in winter is significantly lower than in summer. Many locations in the northern United States and Canada, Northern Europe, and Russia can generate only one-third of the solar power in winter as they can in summer.
Many parts of the world, though, are surprisingly uniform in terms of solar power generation potential. For many countries in the Global South, differences of 25% between months are more typical than the 300% change in the high Northern latitudes. Even the land areas in the Southern Hemisphere are not as extreme as the Arctic.
The lack of strong seasonality in the Southern Hemisphere is largely because the continents are location much closer to the equator in the Southern Hemisphere. The ocean that wraps around Antarctica is a sizable fraction of the Earth. The sliver of South America that juts towards Antarctica is a rare exception; Punta Arenas is located at 53 degrees South latitude (Liverpool, England is at a comparable latitude in the Northern Hemisphere). More populated cities like Cape Town, South Africa, Auckland, New Zealand, and Melbourne, Australia are all located between 34 and 38 degrees S (equivalent latitudes to the band between Wilmington, North Carolina and Louisville, Kentucky).
While generally the summer month (June in the Northern Hemisphere and December in the Southern Hemisphere) receives the most sunlight, there are some tropical locations like India that receive more light in December than in June, because of heavy monsoonal rainfall during summer.
If solar power is to generate most of the electricity in any location, one might imagine overbuilding solar capacity to satisfy the winter demand with generation during the day and storage at night. This would then require curtailment of the summer excess power production, which is not a technical challenge but would be less economical. Still, since the price of solar has dropped so considerably, overbuilding solar plus some wind might be an economical way to generate 100% clean energy.
Overbuilding plus curtailment at a large-scale grid level is potentially an ideal solution for energy justice, if a significant amount of solar is installed on rooftops. What would you do with all that free electricity?
Connect
The Initiative for Energy Justice describes themselves as “getting into the weeds for the grassroots.” They work to bring visions of “a just transition to an equitable and renewable energy economy… into reality by providing concrete law and policy resources to advocates and policymakers.”
- Check out their Justice in 100 Scorecard, that evaluates pledges of 100% clean energy from a justice perspective.
- Read co-founder Shalanda Baker’s new book Revolutionary Power: An Activist’s Guide to the Energy Transition, a compelling story of why we need energy justice and how policy can help bring clean energy to those who need it most.
