
5 Hemoglobin Disorders
Session Level Objectives (SLOs): after completing the session, students will be able to:
SLO 1. Describe the major types of structural hemoglobinopathies.
SLO 1. Describe the major types of structural hemoglobinopathies.
Major types of structural hemoglobinopathies:
SLO 2: Describe the organization of the globin gene loci and developmental switch from gamma to beta globin gene expression as a foundation for understanding hemoglobin disorders.
Diseases caused by mutations that alter hemoglobin function are probably the most prevalent and best-understood of all Mendelian genetic disorders. At least 1 in 15 people carry genetic variants that contribute to hemoglobin-related disorders. To understand the hemoglobinopathies we need to start by looking at the genes that encode the various Hb chains, and their expression patterns (Fig. 1).
- First, note that during gestation, Hb is initially produced in the yolk sac and then in the liver. Toward the end of gestation, Hb production gradually switches to the bone marrow.
- Concomitant with the changes in the locations of Hb production, the chain types produced are also changing. The major form of fetal and infant Hb, HbF (α2γ2), is gradually supplanted by adult Hb A (α2β2).
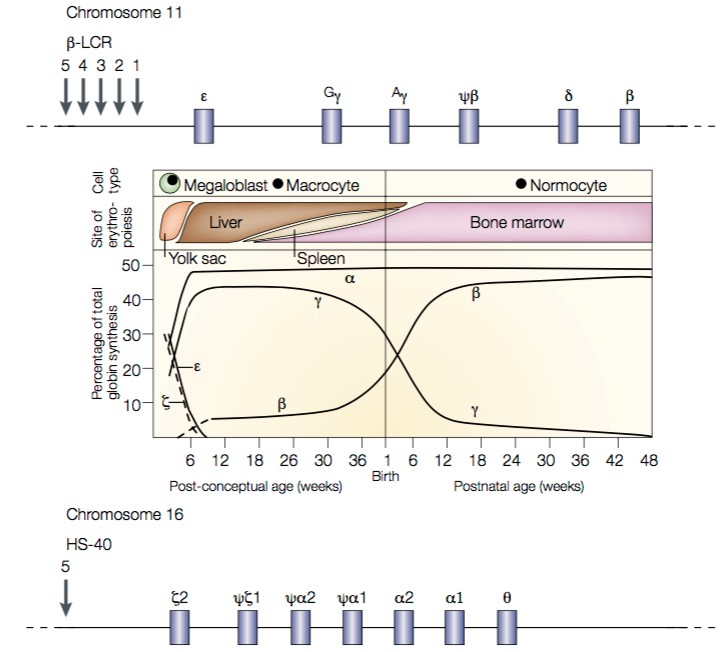
Fig. 1. Expression patterns of Hb α-like and β-like chains. On top is a map of the β-like globin loci on chromosome 11. The Locus Control Region (LCR) contains a series of enhancer sites required for expression of all β- like globin loci. Additional enhancer and repressor elements then control the expression of each specific globin gene. On the bottom is a map of the α-like globin loci on chromosome 16. Note that there are two identical copies of the α-globin gene. Source: Weatherall, Nat Rev Genetics 2001.
- These changes are called Hb switching. They represent a classical example of developmental regulation of gene transcription. The mechanisms through Hb switching occurs include both the types of mechanisms we have already seen, and “epigenetic” changes in DNA packaging (chromatin regulation) that we’ll see in more detail later.
- When we look at the arrangement of the genes that encode Hb chains, we see that they are arranged in clusters: the β-like loci sit together on chromosome 11, and the α-like loci sit together on chromosome 16.
- Remarkably — and unusually — each set of genes is arranged in its temporal order of expression.
SLO 3. Describe the mechanistic bases of hemoglobin disorders including sickle cell disease and thalassemia.
Sickle cell disease (hemoglobin S disease)
Sickle Cell Anemia is the most prevalent single hemoglobinopathy. It falls within the broader class of hemolytic anemias.
Note — Cyanosis vs. Pallor. You cannot manifest red (or blue) color without blood. Pallor (being pale) reflects anemia. Cyanosis (being blue) indicates that blood is poorly oxygenated. As mentioned above, HbS carries O2 normally, but leads to clogging of capillaries and hemolysis, the latter resulting in anemia.
- Sickle disease results from a single nucleotide missense substitution, βS, that changes a codon for glutamate to a codon for valine at amino acid position 6 in the Hb β–chain (β–globin).
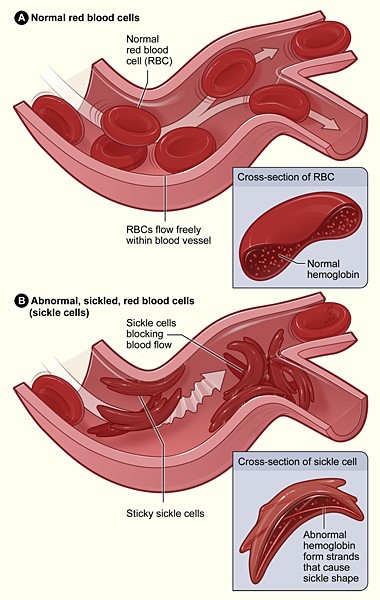
Fig. 2. Effect of HbS (α2Sβ2S) on erythrocyte morphology and function. Source: National Institutes of Health. - The β S mutation has no effect on the ability of Hb to carry O2.
- Heterozygote carriers of the sickle allele, referred to as βS, generally present few or no symptoms. Extreme physical exertion can lead to rhabdomyolisis.
- Heterozygote carriers exhibit partial resistance to malaria. The βS allele appears to have appeared de novo multiple times. Its prevalence is elevated in populations in the Mediterranean, Africa, and southern Asia, all areas with endemic malaria.
- Heterozygous carriers of the sickle trait produce a mix of Hb tetramers: α2A β2A (normal HbA), α2A β2S (sickle HbS), and α2A βA βS.
- Homozygotes with sickle cell disease produce mainly α2A β2S (sickle) Hb tetramers.
- The O2-free form of HbS, deoxyHbS (deoxy- HbS), is five times less soluble than deoxyHbA.
- At the high concentrations of HbS that are present in homozygotes, deoxy–HbS tetramers assemble into long, higher-order filaments. These deoxy-HbS filaments distort the normal rounded shape of erythrocytes, leading to clogging of capillaries. The fibers can also puncture the cell’s membrane, causing erythrocyte lysis (hemolysis).
- Sickle crisis is an episode of extreme pain lasting hours to days. Generally, crisis is thought to result from sickled erythrocytes blocking blood flow, particularly to bones. A short (2 min.) video on sickle crisis is here:
https://www.nejm.org/do/10.1056/NEJMdo005311/full/
This is one of many examples you’ll see of protein folding diseases.
Other hemoglobinopathies
In addition to S disease there are a large number of mutations in the various Hb chains that can lead to disease. These fall into three categories:
- Structural hemoglobinopathies. These disorders are generally caused by missense mutations that alter the primary structure of Hb chains. Sickle (HbS) disease is an example.
- Thalassemias. These disroders are caused by imbalances in the amounts of α- and β-chain synthesis, degradation, or Hb tetramer assembly, leading to excess production of unassembled globin chains. Note: some structural hemoglobinopathies can result in thalassemia.
- Hereditary persistence of fetal hemoglobin (HSPS). These are regulatory disorders in which the switch from HbF to HbA fails to occur in early childhood. HSPS by itself does not lead to major pathology, but it can be a strong genetic modifier of other hemoglobinopathies and thalassemias.
An absolutely key point is that there are two identical copies of the Hb α-chain gene on chromosome 16 (See fig. 4). This means that most people have four copies of the α-chain gene. Consequently, recessive disorders of Hb β–chains are far more frequent, and tend to be more severe, than disorders of the Hb α-chains.
Moreover, because of the temporal order of Hb chain expression (Fig. 3), disorders of Hb β–chains tend to manifest only in childhood (recall that HbA is α2β2), while disorders of Hb α-chains can begin manifesting prenatally (HbF is α2γ2).
Structural hemoglobinopathies
For the Hb β–chain (β-globin) alone, mutations leading to the synthesis of well over 700 different structural variants of the protein have been identified. Additional variants in other globins can also cause disease.
The Hb structural variants were originally named with letters (HbS, HbE, etc., and later, they were named by the location where the carriers of the mutations were identified (Hb Hammersmith, etc.). Structural mutations can lead to changes in the O2 saturation curve (and cyanosis, as in Hb Hammersmith), changes in Hb solubility, and hemolysis (as in HbS), to thalassemias, or combinations of these defects.
In addition, the iron in the heme center can be oxidized by bound O2, from ferrous (Fe2+) to ferric (Fe3+) iron. Hb containing an oxidized heme center cannot bind O2, and is called methemoglobin. An enzyme, methemoglobin reductase converts the heme iron to the ferrous (Fe2+) state, and restores its ability to carry O2.
Mutations that impair methemoglobin reductase cause gradual conversion of Hb to methemoglobin, resulting in cyanosis. Moreover, some structural variants of Hb (such as Hb Hyde Park) cannot productively engage with methemoglobin reductase, and these also gradually convert into methemoglobin (also leading to cyanosis).
Thalassemias
A vast variety and number of mechanisms and mutations cause imbalances in globin chain abundance. The resulting diseases occur through a variety of mechanisms, with diverse presentations and severities. Collectively, these diseases are called thalassemias.
- α–thalassemia. Recall that there are two α-globin genes on chromosome 16 (Fig. 1). α-thalassemias most commonly arise through deletion of entire α1 or α2 genes.
- The silent carrier genotype is –α/αα, resulting in 75% of normal α-globin production.
- The α-thalassemia trait occurs in two forms: – –/αα, and –α/–α. These genotypes result in 50% of normal α-globin production.
- Simple α-thalassemia disease is associated with the – –/–α genotype. Only 25% of the normal α-globin amount is produced, and an excess of Hb β4 tetramers are produced. This variant is also called HbH.
- The – –/– – genotype results in assembly of Hb γ4 tetramers called Hb Bart’s. The lack of alpha-globin expression results in “Hb Bart syndrome” or “Hb Bart hydrops fetalis.” Because this genotype is embryonic lethal, the switch from γ to β expression never occurs.
- β–thalassemia. A wide variety of mutations can cause reduced production of β globin chains, and β-thalassemia. We review these because they illuminate and summarize many of the ways that mutations can change protein production.
- The locus control region (LCR; Fig. 1) is needed for transcription of the entire set of β-like globin chains. Deletions within the LCR can decrease or eliminate transcription of all of the β-like genes.
- Similarly, mutations in the β-chain promoter can impair transcription of the β-chain mRNA alone, but leave transcription of the other β-chain genes intact.
- Mutations in the β-chain transcription unit can prevent formation of a functional mRNA template:
- Defects in 5´cap addition;
- mRNA splicing defects;
- Failure of poly–A tail addition;
- Point mutations that eliminate the start codon;
- Insertions or deletions (indels) that cause frameshifts;
- Introduction of premature stop codons (nonsense mutations).
- Missense mutations (like those in the structural hemoglobinopathies) can also cause instability β-chain protein and its destruction by the protein quality control system.
- As with sickle cell trait (HbS), heterozygotes carrying the α- and β-thalassemia traits are partially protected from malaria. These traits (and hence, the associated diseases) occur at elevated levels in populations affected by endemic malaria. Because most disease alleles are in carriers compared to affecteds for recessive disorders (2pq>>q2), a fitness advantage to carriers often outweighs the loss of fitness among those with disease. (As used here, fitness refers to survival to reproduction.)
Feedback: