
Rain-on-Snow Flooding
Nicholas Wayand and Ryan Currier
Overview
Focus Questions
- What is a Rain-on-Snow Flood?
- What causes the snow to melt?
- How might Rain-on-Snow events change in the future within the Pacific Northwest?
Learning Goals
Students will be able to…
-
Explain what parts of the energy balance are important for melting snow during different weather conditions.
-
Relate changes in climate projections of the PNW to our snowmelt model.
- Explain that water for rain-on-snow flooding comes largely from the rain itself, with a number of forms of heat energy contributing to the <25% of the water from melting snow.
Materials
- Background Information video (Youtube)
- Introduction Powerpoint (in PCC Google Drive folder)
- Excel Model (.xlsx)
Procedure
Introduction:
Introduce the class to Rain-on-Snow flood events by watching the video (linked above) and using the provided slideshow.
Activity: Simulating the Snoqualmie Pass Snowpack
This model simulates the components of the energy balance of a snowpack over a day (24 hours) and calculates the snowmelt, rainfall and total water available for runoff.
Model overview:
- Open up “Snow Melt Activity.xlsx”.
- The Inputs required are the meteorological weather conditions above the snowpack that day:
- Air temperature (C)
- Wind speed (m/s)
- Relative humidity (%)
- Precipitation (mm/day)
- Solar Radiation (W m2 day-1 )
- Thermal Radiation (W m2 day-1 )
- These values need to be averaged over a 24 hour period. Changing these values will update the Output boxes that show modeled rainfall and snowmelt from each energy balance component.
- The equations used to calculate each component of the snow surface energy balance are shown to the right (Columns Q-AD). These equations take the input weather conditions and calculate the total energy from each component in the Red output box.
- Then, the sum of all components is converted into a depth of meltwater.
- Finally, any rainfall that drains through the snowpack is added to the snowmelt to produce the total Water available for Runoff. Runoff is any water that does not enter the soil, but literally runs-off and would eventually enter a river, where it can cause flooding, generate power, or provide drinking water.
Questions for students:
- What energy balance components melt the most snow at Snoqualmie Pass?
- Click on the second tab “INPUT Options”, which contains meteorological input data for three different distinct days at the Snoqualmie Pass station.
- Copy and paste the input data from each day into the Input box on the main tab.
- What components provide the most energy on each type of day?
- What days generated the most melt at the site?
- What matters more for basin flooding during an extreme rain-on-snow event? Snowmelt or rainfall?
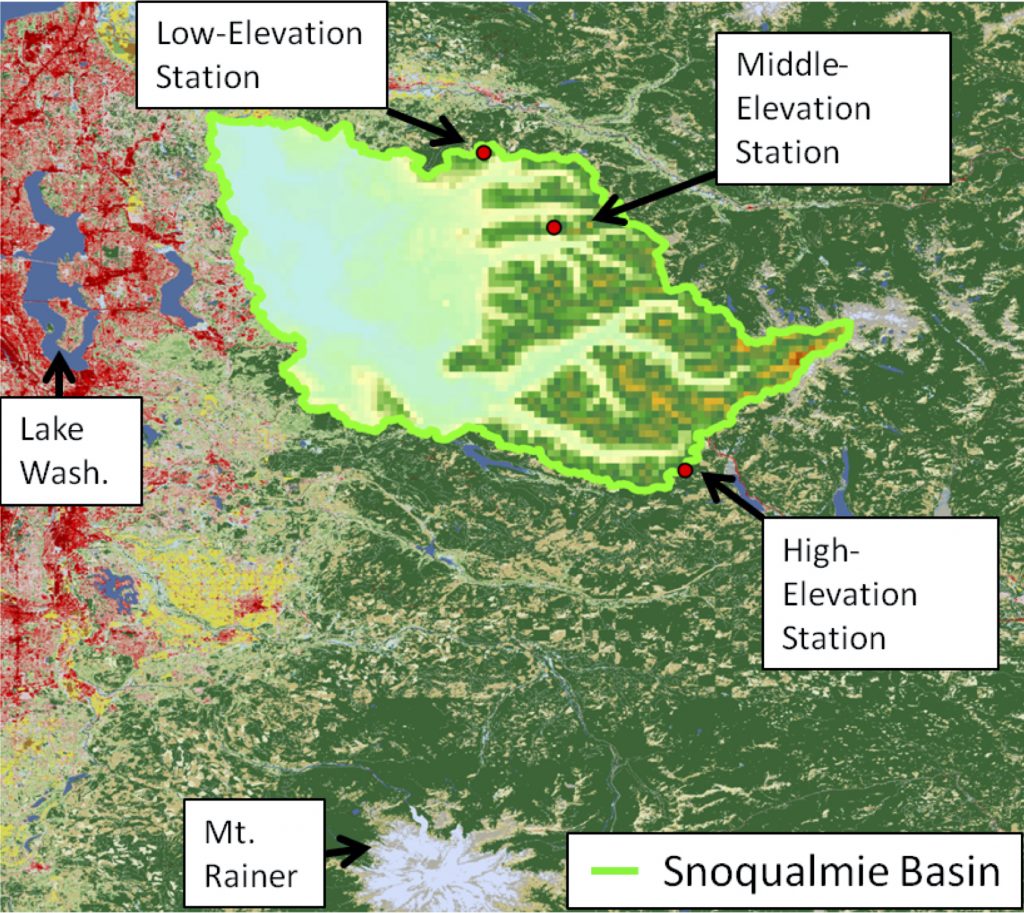
- Examine the map of the Snoqualmie Basin and locations of three stations at high, middle, and low elevations. (This figure is also included in the PowerPoint presentation)
- Move to the third tab “Historic Snoqualmie Flood”.
- Use the meteorological input from the three stations at High, Middle and Low elevations within the Snoqualmie Basin to run the snow model at each station.
- Comment on the importance of snowmelt vs. rainfall at different elevations on the 8th of January 2009. What is the ratio of snowmelt to rainfall at each elevation?
- Assuming that each station represents one-third of the total basin area, what is the total basin ratio of snowmelt to rainfall?
- The future climate of the PNW is projected to be warmer and see extreme storms more often. In what ways could an increased winter air temperature and more frequent extreme precipitation impact rain-on-snow floods in the Snoqualmie Basin and PNW?
Additional Resources
Overview of Rain on Snow Events
Kattelmann, R. (1997) Flooding from rain-on-snow events in the Sierra Nevada. Destructive Water: Water-Caused Natural Disasters, their Abatement and Control (Proceedings of the Conference held at Anaheim California, June 1996) IAHS Publ. no. 239.
1996 Flood Event in Oregon
Marks, D., Kimball, J., Tingey, D. and Link, T. (1998) The senstivity of snowmelt processes to climate conditions and forest cover during rain-on-snow: a case study of the 1996 Pacific Northwest flood. Hydrological Processes, 12, 1569-1587.
Source for Excel Snow Model Equations
Storck, Pascal (2000) Trees, Snow and Flooding: An Investigation of Forest Canopy Effects on Snow Accumulation and Melt at the Plot and Watershed Scales in the Pacific Northwest. Water Resources Series Technical Report No. 161. March 2000. Seattle, Washington.
Musselman, K.N., Lehner, F., Ikeda, K. et al. (2018) Projected increases and shifts in rain-on-snow flood risk over western North America. Nature Climate Change, 8, 808–812. https://doi.org/10.1038/s41558-018-0236-4
Mazurkiewicz, A.B., Callery, D. G., McDonnell, J.J. (1997) Assessing the controls of the snow energy balance and water available for runoff in a rain-on-snow environment. Journal of Hydrology. https://doi.org/10.1016/j.jhydrol.2007.12.027
