Climate Change and Hydrology
Oriana Chegwidden
Overview
Target Audience: Middle School Students
Background Vocabulary
Hydrology, precipitation, evapotranspiration, streamflow, infiltration, groundwater, sunlight/radiation/energy, distinction b/w snowpack/glacier, ablation, water year
Materials
- Paper
- Pencils/Markers
Procedure
PART 1: Thinking about hydrologic processes (20 minutes total – 5 minutes explanation, 10 minutes small group, 5 minutes back together for group discussion)
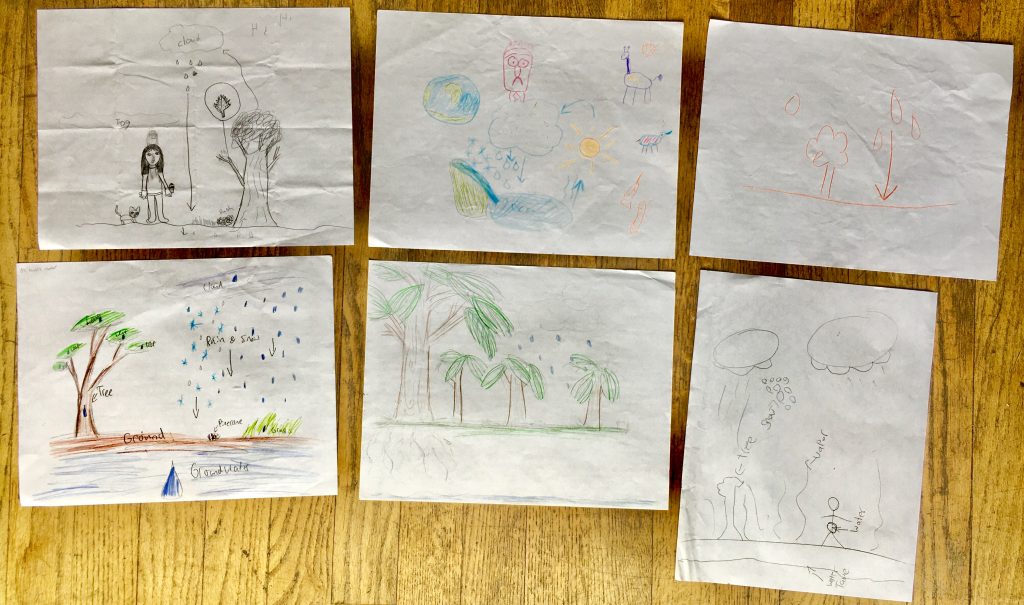
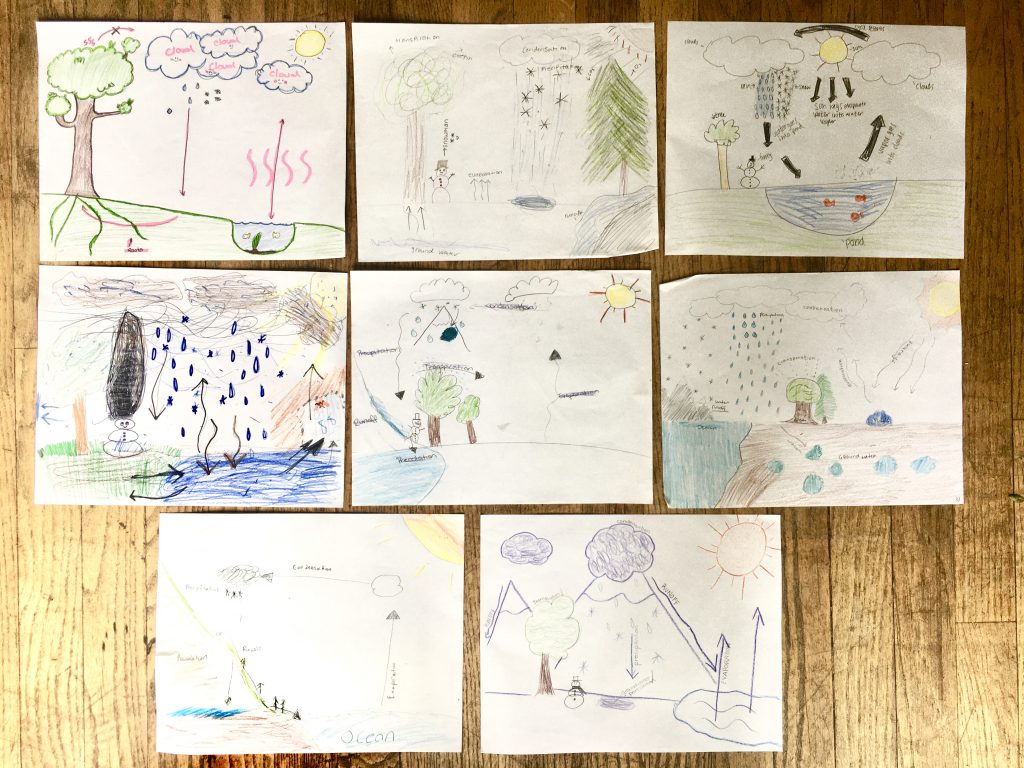
Groups of three draw the different sources and sinks of water and energy in the landscape around them. They draw arrows and make it as pretty as they want. If the landscape is varied, get one group to do bare ground, one group to do snow-covered and one group to do glacier. Key ideas to try to get them to think about: vegetation, groundwater, different forms of precipitation, evaporation, runoff, soil moisture
PART 2: Linking processes to time (10 minutes total – 2 minutes explanation, 5 minutes small
group, 3 minutes discussion)
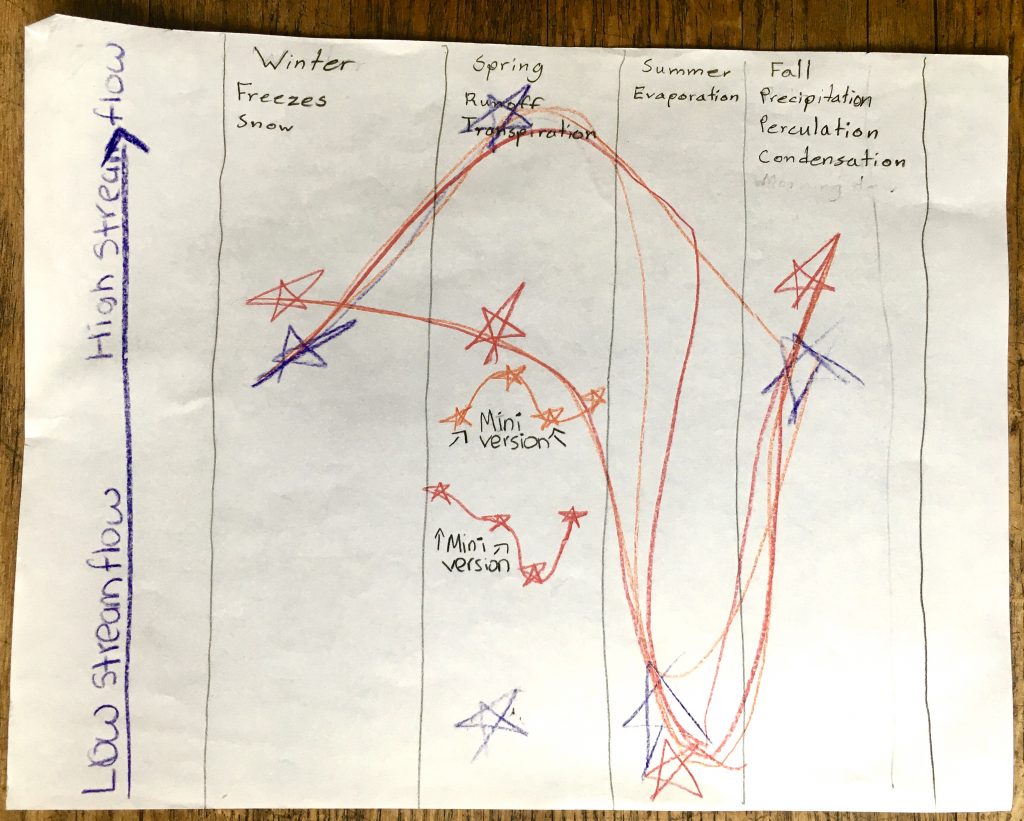
Give each group a piece of paper with four columns representing the seasons of the year. Groups take the pictures they drew in part 1 and fill in the columns with which processes are happening during each season of the year. (i.e. They’d put snowmelt in the spring/summer column and snowfall in the winter column).
PART 3: Making a streamflow hydrograph (10 minutes total – 2 minutes explanation, 5 minutes
small group, 3 minutes discussion)
For each season of the year choose whether they think there will be low, medium, or high streamflow in the stream coming off of the landscape. Then connect those dots and have a seasonal hydrograph. Then hand them each the actual hydrograph for a nearby stream and they can see how they figured it out!
PART 4: Predicting the future (10 minutes total – 2 minutes explanation, 5 minutes small group,
3 minutes discussion)
Given that we know it will get warmer going through the 21st century, how will those processes change? Have them take the plots they drew in Part 2 and decide how streamflow will change under a warmer climate (key points: get them to think about snow falling as rain instead, snow melting earlier and maybe changes to groundwater). Have them guess what the future streamflow could be.
Example drawing and streamflow graphs: