
21 Review And Practice
Summary
Economists insist that individuals do not make choices willy-nilly. Rather, economists assume that individuals make choices in a purposeful way, one that seeks the maximum value for some objective. We assume that consumers seek to maximize utility and that firms seek to maximize profits.
Whatever is being maximized, choices are based on the marginal decision rule. Following this rule results in an allocation that achieves the greatest degree of utility or profit possible.
We also examined the model of utility-maximizing behavior. Economists assume that consumers make choices consistent with the objective of achieving the maximum total utility possible for a given budget constraint.
Utility is a conceptual measure of satisfaction; it is not actually measurable. The theory of utility maximization allows us to ask how a utility-maximizing consumer would respond to a particular event.
By following the marginal decision rule, consumers will achieve the utility-maximizing condition: Expenditures equal consumers’ budgets, and ratios of marginal utility to price are equal for all pairs of goods and services. Thus, consumption is arranged so that the extra utility per dollar spent is equal for all goods and services. The marginal utility from a particular good or service eventually diminishes as consumers consume more of it during a period of time.
Utility maximization underlies consumer demand. The amount by which the quantity demanded changes in response to a change in price consists of a substitution effect and an income effect. The substitution effect always changes quantity demanded in a manner consistent with the law of demand. The income effect of a price change reinforces the substitution effect in the case of normal goods, but it affects consumption in an opposite direction in the case of inferior goods.
Concept Problems
- What is achieved by selecting the quantity of an activity at which marginal benefit equals marginal cost?
- Suppose the marginal benefit of an activity exceeds the marginal cost. What does the marginal decision rule say a maximizing decision maker will do?
- Suppose you are a discus hurler and your goal is to maximize the distance you achieve. You “produce” discus hurls by practicing. The total benefit of practice is distance achieved, and the input that achieves this distance is hours of practice. Describe the total benefit curve of practice. What point on the curve would you select?
-
This chapter argues that consumers maximize utility and firms maximize profits. What do you suppose each of the following might be presumed to maximize?
- A minister or rabbi
- A United States Senator
- The manager of a major league baseball team
- The owner of a major league baseball team
- The director of a charitable organization
- Suppose you really, really like ice cream. You adore ice cream. Does the law of diminishing marginal utility apply to your ice cream consumption?
- If two commodities that you purchase on a regular basis carry the same price, does that mean they both provide the same total utility? Marginal utility?
- If a person goes to the bowling alley planning to spend $15 but comes away with $5, what, if anything, can you conclude about the marginal utility of the alternatives (for example, bowl another line, have a soda or a sandwich) available to the person at the time he or she leaves?
- Which do you like more—going to the movies or watching rented DVDs at home? If you engage in both activities during the same period, say a week, explain why.
- Do you tend to eat more at a fixed-price buffet or when ordering from an a la carte menu? Explain, using the marginal decision rule that guides your behavior.
- Suppose there is a bill to increase the tax on cigarettes by $1 per pack coupled with an income tax cut of $500. Suppose a person smokes an average of 500 packs of cigarettes per year—and would thus face a tax increase of about $500 per year from the cigarette tax at the person’s current level of consumption. The income tax measure would increase the person’s after-tax income by $500. Would the combined measures be likely to have any effect on the person’s consumption of cigarettes? Why or why not?
- How does an increase in income affect a consumer’s budget line? His or her total utility?
Numerical Problems
- Mitchell Seaborg loves baseball. The table below shows the relationship between the number of games he attends per month, and the total utility of baseball consumption.
| Number of Baseball Games Per Month | Total Utility |
| 0 | 0 |
| 1 | 70 |
| 2 | 130 |
| 3 | 180 |
| 4 | 220 |
| 5 | 270 |
-
- Add to the table showing the marginal utility from baseball games.
- At an average ticket price of $35, Mitchell can justify attending only 1 game per month. Calculate the marginal utility per dollar, based on this price.
- Calculate the maximum price for level of marginal utility, using the value from (b).
- Plot the demand curve, using the values from (c).
-
-
-
Joe Higgins is thinking about how much time to spend studying for a biology exam tomorrow. Using “utility units” he measures the benefits and costs of study; his calculations are shown in the following table.
Figure 4.17
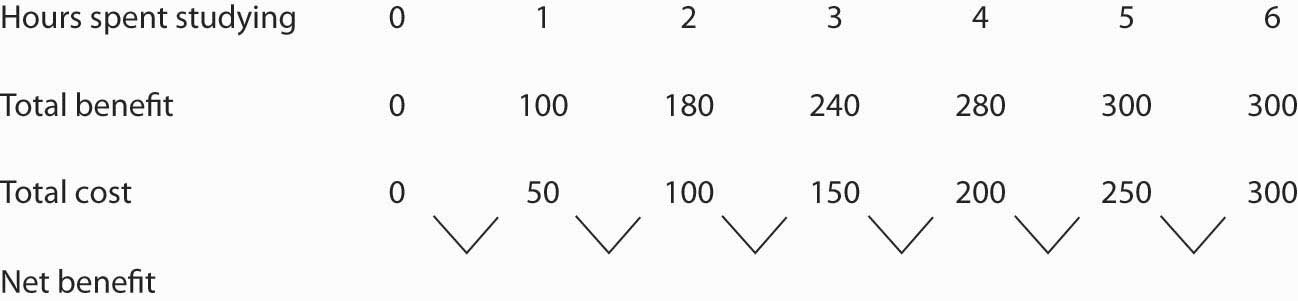
- Fill in the fourth row for net benefit in the table. Use the midpoint convention to emphasize that the net benefit is a marginal value showing the gain as hours spent increase by one-hour increments.
- Using a graph similar to Panel (a) of Figure 4.1 “The Benefits of Studying Economics” show the marginal benefit curve and verify that the area under the curve at 3 hours of study corresponds to the total benefit of that much study. (Hint: Remember that marginal values are plotted at the midpoints of the corresponding intervals on the horizontal axis.)
- Use a graph similar to Panel (b) of Figure 4.1 “The Benefits of Studying Economics” to show the marginal cost curve and verify that the area under the curve at 3 hours of study corresponds to the total cost of that much study.
- Use a graph similar to Panel (a) of Figure 4.6 “Using Marginal Benefit and Marginal Cost Curves to Determine Net Benefit” to combine the marginal benefit and marginal cost curves you drew in parts (a) and (b).
- Based on the marginal decision rule, how many hours should Joe spend studying for his biology exam?
-
Now suppose some friends of Joe’s call to say they are having a party tonight. Joe calculates that the party is now his best alternative to study, and he increases his estimate of the cost of each hour of study. One hour of study now costs 70; two hours cost 140; three hours 210, four hours 280; five hours 350; and six hours 470.
- Draw the new marginal benefit and marginal cost curves as in Problem 13, part (d):
- Based on the marginal decision rule, identify the new solution that maximizes the net benefit of study time.
-
The table shows the total utility Jane derives from eating pizza in the evening while studying.
Pieces of pizza/evening Total Utility 0 0 1 30 2 48 3 60 4 70 5 78 6 80 7 76 - How much marginal utility does Jane derive from the third piece of pizza?
- After eating how many pieces of pizza does marginal utility start to decline?
- If the pizza were free, what is the maximum number of pieces Jane would eat in an evening?
- On separate diagrams, construct Jane’s total utility and marginal utility curves for pizza. Does the law of diminishing marginal utility hold? How do you know?
- Suppose the marginal utility of good A is 20 and its price is $4, and the marginal utility of good B is 50 and its price is $5. The individual to whom this information applies is spending $20 on each good. Is he or she maximizing satisfaction? If not, what should the individual do to increase total satisfaction? On the basis of this information, can you pick an optimum combination? Why or why not?
- Sally and Marie settle down to watch the evening news. Marie is content to watch the entire program, while Sally continually switches channels in favor of possible alternatives. Draw the likely marginal utility curves for watching the evening news for the two individuals. Whose marginal utility curve is likely to be steeper?
- Li, a very careful maximizer of utility, consumes two services, going to the movies and bowling. She has arranged her consumption of the two activities so that the marginal utility of going to a movie is 20 and the marginal utility of going bowling is 10. The price of going to a movie is $10, and the price of going bowling is $5. Show that she is satisfying the requirement for utility maximization. Now show what happens when the price of going bowling rises to $10.
-
The table shows the total utility (TU) that Jeremy receives from consuming different amounts of two goods, X and Y, per month.
Quantity TUx MUx MUx/Px TUy MUy MUy/Py 0 0 0 1 50 75 2 88 `117 3 121 153 4 150 181 5 176 206 6 196 225 7 214 243 8 229 260 9 241 276 10 251 280
- Fill in the other columns of the table by calculating the marginal utilities for goods X and Y and the ratios of marginal utilities to price for the two goods. Assume that the price of both goods X and Y is $3. Be sure to use the “midpoint convention” when you fill out the table.
- If Jeremy allocates $30 to spend on both goods, how many units will he buy of each?
- How much will Jeremy spend on each good at the utility maximizing combination?
- How much total utility will Jeremy experience by buying the utility-maximizing combination?
- Suppose the price of good Y increases to $6. How many units of X and Y will he buy to maximize his utility now?
- Draw Jeremy’s demand curve for good Y between the prices of $6 and $3.
-
-

