
9 Going Up?: Lapse Rate and Tropopause
Hot air rises, because it’s less dense. So why is it cold on the top of mountains? Check out the video below.
The answer is decompression of air, and if air parcels rise adiabatically, that is, without any heating and cooling, they have constant dry static energy s = cp T + g z, where g = 9.8 m/s2 is gravitational acceleration and z is the elevation above the surface. For those familiar with the concept of potential temperature, dry static energy divided by cp is a similar quantity, only neglecting kinetic energy. The lapse rate Γ = – dT/dz is the rate at which temperature decreases with height and is often measured in K/km. For dry adiabatic ascent,
[latex]\Gamma_d = g/c_p = 9.8 K/km[/latex].
Rising air parcels quickly become colder, which lowers the saturation specific humidity, and increases relative humidity. Eventually any air with moisture can become saturated, with enough adiabatic rising.
The actual lapse rate in the troposphere is usually much less than Γd, often around 6-7 K/km, but varying significantly with location and weather conditions. It’s much hotter aloft than would be expected if the lapse rate was dry adiabatic, by 25-45 K in the upper troposphere, around 10 km in elevation. If this seems close to the water vapor values in energy units that we discussed last chapter, it’s no coincidence. The primary determinant of the lapse rate on Earth is moisture.
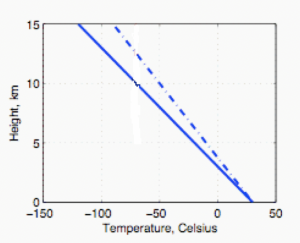
Schematic of dry adiabatic lapse rate (solid) and 6.5 K/km lapse rate (dash-dot).
In the tropics in particular, the average vertical temperature profile is rather close to constant moist static energy m = cp T + g z + Lv q with height. Tropical clouds rise within large cloud systems, as in the satellite image below, releasing huge amounts of latent heat in the process. As condensation occurs, there is a transfer of energy from humidity (Lv q) into dry static energy (cp T + g z). By the time the clouds spread out at the tropopause, temperatures are so cold that there is little water vapor left (qtrop = 0, with the “trop” subscript indicating tropopause). Tropopause temperature and height can be related to surface (zsurf = 0, with “surf” indicating surface) temperature and humidity via:
[latex]c_p T_{trop} + g z_{trop} = c_p T_{surf} + L_v q_{surf}[/latex]
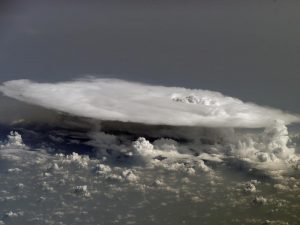
Anvil cloud in the tropics. Source: NASA.
As temperatures rise, so does the moisture content, approximately 7%/K. In the tropics, 1 K of surface warming corresponds to an increase of over 3 K of water vapor in temperature units. Thus with 1 K of global warming, upper tropospheric temperatures in the tropics warm by 4 K. Enhanced warming in the tropical upper troposphere is one of the most expected effects of global warming, and although it might seem benign, it ends up having an effect on many aspects of climate. The first we’ll discuss is the rising of the weather layer of the atmosphere. The recognition that other layers of the atmosphere even exist is relatively recent, so let’s learn a little about the history of this discovery.
Discovery of the tropopause
Even in 1900, atmospheric scientists expected that the “colder at higher altitudes” rule held true everywhere. A French scientist, Léon Teisserenc de Bort, was the first to prove otherwise, discovering the stratosphere in a landmark study in 1902. Teisserenc de Bort was from a wealthy family, and after a tenure at the weather bureau, his inheritance allowed him to work on atmospheric research independently from his estate outside Paris.
Scientific research rarely goes as planned, but one of his early hiccups actually inconvenienced nearly the whole population of Europe. His high altitude temperature measurements first used kites with extremely long lines, up to 5 miles in length. One of his kites broke free and took down a telegraph line that connected Paris and Rennes right when Europe was awaiting the news from Rennes about the verdict of the “trial of the 19th century,” the Dreyfus Affair. It is perhaps not surprising that Teisserenc de Bort soon switched to fast-rising balloons for his measurements.
Balloons ended up being a much better choice, because they can ascend even higher than kites. Scientists began using hot air balloons for research a century before, riding in the gondola and taking measurements by hand as they rose. High altitude voyages in balloons required the explorers to battle extreme cold and low oxygen conditions aloft. As scientists and balloonists attempted to push higher and higher into the skies, these explorations became as dangerous as fluorine chemistry. In 1862 James Glaisher and Henry Coxwell pushed their bodies to the limit in a record-setting flight over England, rising to at least 29,000 feet, equivalent to the height of the summit of Mount Everest. Their voyage was performed without any oxygen tanks, and it is a wonder that they survived. Near their maximum altitude, Glaisher, the scientist, passed out from lack of oxygen and Coxwell, the balloonist, was experiencing extreme numbness of his hands. The safety release cord had dislodged as well, requiring him to ascend into the ring above to go after it. With hands blackened and immobile from frostbite and the lack of oxygen, Coxwell performed what is certainly one of the most bad-ass maneuvers in the history of science: he saved himself and his companion from certain death by pulling the safety release cord with his teeth, sending them back to the surface for a safe landing.
Teisserenc de Bort did not fly in his balloons, but rather instrumented some of the first incarnations of hydrogen-filled, freely-released weather balloons that are still used today. Free balloons must be fully automated and can float a considerable distance before their eventual descent. Technological advances that were also used on his meteorological kites, including clockwork mechanisms to record data with time, had improved the automation and accuracy of these instruments. The balloons were tracked carefully on their way up, as part of the measurement procedure and also to help the scientists recover the instrument package. A message on the package promising a tidy reward, around a week’s salary for a typical worker, was usually sufficient to ensure that lost weather balloon instruments were returned.
Teisserenc de Bort’s balloons easily soared above the heights achieved by Glaisher and Coxwell in their flight, with some balloons taking data up to 42,000 feet. His instruments consistently showed that temperatures did not always decrease with height: the decrease stopped at a certain altitude, around 30,000 feet above Paris. His discovery seemed so impossible that the scientist chalked it up to measurement error for years. He made hundreds of flights over all seasons, day and night, and repeated his measurements with many different types of instruments to ensure that his experimental setup was not to blame. He finally published his results in 1902, which were soon after confirmed by other scientists. These results provided the first hints of the existence of something important higher up in the sky, and many scientists turned their focus upwards. The presence of significant ozone in the stratosphere was measured in the next decade, and the reasons that the ozone layer exists were elucidated in 1930.
Indeed it is the ozone layer that causes the temperatures to warm up aloft in the first place. Ozone absorbs harmful ultraviolet light from the Sun, and although it only amounts to a small fraction of the Sun’s energy, it is sufficient to heat the thin air in the ozone layer to temperatures that are several tens of kelvin above the upper tropospheric values below.
Ozone is a quintessential example of how minuscule amounts of a substance can make a big difference. If all the ozone molecules in the world were brought to the surface of the Earth, it would make a layer of gas only a little less than 1/8th of an inch thick, about the same thickness as two pennies stacked on top of each other. Even in the heart of the ozone layer, there is only one molecule of ozone per hundred thousand of other gases. Yet those few molecules block nearly all of the most harmful ultraviolet (UV) radiation from the Sun.
When ozone absorbs ultraviolet light, it heats the air slightly. This relatively small heating means temperatures are higher within the ozone layer than above and below it. The stratosphere is bounded by the cold tropopause below and the warm stratopause above.
Changes in tropopause height with warming
A decent approximation of the lower stratospheric temperature is a fixed, constant temperature. This temperature would be determined by aspects of the climate such as ozone content, carbon dioxide content, solar forcing, and stratospheric circulations like the Brewer-Dobson Circulation. The stratosphere puts a lid on convection, as can be seen in the anvil cloud image above.
A very simple theory for the tropopause height (not quantitatively accurate but conceptually useful) can be explained with a graphical argument. Start with the surface temperature and draw a line with constant lapse rate upward. Then draw the constant temperature of the stratosphere straight downward. Their intersection is the tropopause height, with the troposphere below and the stratosphere above, in this simple theory.
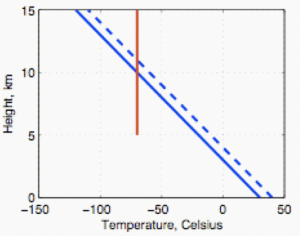
Simple theory that illustrates the tropopause height rise with warming. The constant stratospheric temperature is plotted in red, the tropospheric temperature before warming in solid blue, and the temperature after warming in dashed blue.
In this theory, it’s easy to see why a warming would cause a rise in tropopause height. The tropospheric lapse rate intersects the stratosphere at a higher altitude, as illustrated in the above figure. Decreases in lapse rate also cause the tropopause to rise and is the dominant term, given the 3:1 ratio of humidity increase to temperature increase in the tropics. The rise is Δz = (ΔT + L/cp Δq)/Γ, 600 m per degree. The IPCC AR6 estimates 140-420 m rise from 1981-2015, and Hu and Vallis suggest 600-800 m/century in 1%/yr CO2 increase simulations; each of these suggest the simple model has too much rise. The overestimate in the simplified model presented here is likely the effect of longwave radiation from the troposphere heating the lower stratosphere.
Static Stability and Global Warming
Results from computer models of global warming have suggested that the static stability, a quantity which could be described as the “springiness” of the atmosphere, will increase over much of the globe with rising temperatures. What does this mean, and what implications will it have for the Earth’s climate? Let’s investigate.
So how is the atmosphere like a spring? Under average atmospheric conditions, if you lift up a bit of air (often called a “parcel” of air), it immediately starts rushing back downward, in the direction from which it came. Then it overshoots the place it started from, and goes downward almost as far as it was picked up. It oscillates back and forth like this over and over, taking around 10 minutes to do each lap.
The temperature structure of the atmosphere causes the oscillation. When our parcel of air is lifted, it goes to a place where it’s colder than the air around it. Since colder air is heavier, it then falls back downward.
The opposite happens when air is pushed downward. Below, the parcel is warmer than the air around it, which means it’s lighter, and is pushed back up. These back and forth motions are called buoyancy oscillations.

In addition to the up-and-down motion, the disturbance can spread out, like a wave in the ocean. These waves are called gravity waves, because it is gravity that causes the heavier air to fall back downwards (these should not be confused with the gravity waves that astronomers sometimes talk about, that were predicted by Einstein in his theory of general relativity, which are very different types of waves). Waves aren’t just an ocean phenomenon, they are just as ubiquitous in the atmosphere too!
You can often detect the presence of gravity waves in the atmosphere from patterns of clouds. Condensation and cloudiness tend to occur in air that’s been pushed upward, so ridges of cloudy and cloud-free air often mark the presence of gravity waves (these structures can also be caused by organized roll vortices).

Image courtesy of NASA
Beautiful examples of clouds caused by gravity waves are often seen in Washington just downwind of our big mountains, since mountains are so effective at forcing air upwards. Downwind of the mountains you can often see several lenticular (lens-shaped) clouds, which occur as buoyancy oscillations alternately force air upward and downward.

Static stability varies naturally with height, latitude, and longitude in the atmosphere, and with season as well (here’s a paper I wrote about the seasonal cycle of static stability). Climate models predict a consistent increase in the springiness of the atmosphere with global warming though. This happens in both the tropics (which is well-known among scientists) and also outside the tropics, from 30 to 60 degrees latitude in the Northern and Southern Hemispheres (the midlatitudes, where most of the USA, Europe, Japan, New Zealand, etc are located). My work focused on the midlatitudes in these two studies.
So, why would the atmospheric “springiness” increase with global warming? Computer models have shown that within the weather layer of the atmosphere, global warming is expected to be larger and larger the higher in the atmosphere you go. A figure below from one of my papers illustrates this (click it for a more technical description of this research). So, when air parcels are pushed upwards, they will encounter air that is even warmer, sending the parcels rushing back downwards even faster. It’s just like making a spring tighter, so it bounces back up and down faster.

What effects does increased static stability have on climate? First of all, it’s important to recognize that if it wasn’t for the temperatures changing like this, global warming at the Earth’s surface where we live would be more severe. Increased temperatures in the upper atmosphere allow our planet to shed energy more effectively. This negative lapse rate feedback is a type of planetary safety valve that counteracts some of the effects of our emissions of greenhouse gases. If it didn’t happen, global warming would be even worse than the current predictions.
Static stability is also linked to parts of the climate that can change in a more disruptive way. For instance, static stability has an influence on both the strength and the size of midlatitude weather systems, and on the intensity of large-scale overturning circulations in the atmosphere. Research has suggested that springiness may also be linked to the predicted northward shift of storms over North America, Europe, and Asia in global warming simulations. The northward shift of storms leads to a northward shift of climate zones, precipitation regions, and deserts. A similar shift has occurred in the Southern Hemisphere, with even stronger magnitude.
Adiabatic means without exchanging energy
The lapse rate is the decrease in temperature with height in the atmosphere. Typical lapse rates in the troposphere are 6-7 K/km, but varying significantly based on location and weather conditions.
The weather layer of the atmosphere, located just above the Earth's surface and below the stratosphere. The boundary between the troposphere and stratosphere is called the tropopause and is 7-18 km above sea level, depending on location.
