
6 Glucose Metabolism, Insulin Resistance, and Diabetes
Introduction
Understanding normal glucose metabolism and homeostasis is critical to understanding disorders that affect glucose metabolism. Although there are several conditions that affect the regulation of glucose in the body, diabetes mellitus is the most prevalent and the most relevant to your clinical practice.
Diabetes mellitus is the phenotypic description of several heterogeneous disorders which all share two common clinical aspects: 1) abnormalities in carbohydrate, protein, and fat metabolism because of absolute or relative insulin deficiency; and 2) end organ complications involving the eyes, kidneys, nerves, and blood vessels due to hyperglycemia (high blood sugars). Although the frequency and severity of the complications are extremely variable between patients, the complications are responsible for most of the increased morbidity and increased mortality seen in patients with diabetes.
In this chapter we will review the different hormones involved in glucose metabolism, disorders of glucose metabolism, and will discuss pathogenesis of insulin resistance which leads to type 2 diabetes mellitus. We will then discuss diabetes mellitus including pathogenesis, risk factors, prevention, diagnosis and treatment.
Normal Glucose Homeostasis
The Endocrine Pancreas
The pancreas is located posterior to the bottom half of the stomach. It has both endocrine and exocrine functions. The functions of the pancreas are primarily exocrine (secretion of digestive enzymes), but the pancreas also has endocrine functions. The Islets of Langerhans (aka pancreatic islets) make up the endocrine pancreas and are clusters of cells that secrete hormones. There are several cell types in the pancreatic islets that secrete a variety of hormones. The alpha cells secrete glucagon. The beta cells make up approximately 75% of each pancreatic islet and secrete insulin. The delta cells secrete somatostatin. Somatostatin is an inhibiting hormone and inhibits glucagon and insulin secretion. PP cells (aka gamma cells) are rare and secrete pancreatic polypeptides.
Insulin and glucose
Insulin is the primary hormone involved in glucose metabolism. Insulin is secreted primarily in response to glucose ingestion (the hormone level increases in the fed state). Insulin is an energy storage hormone. Insulin leads to increased peripheral glucose uptake, increased energy storage, inhibition of lipolysis and ketosis, and decreases hepatic glucose output.
In addition to ingestion of glucose, insulin secretion is also stimulated by increased fatty acids and amino acids. Excess adiposity stimulates insulin secretion and may eventually lead to insulin resistance and diabetes.
Insulin is the primary hormone involved in glucose metabolism. It is a polypeptide secreted from the beta cells of the pancreas. Proinsulin is folded in the rough endoplasmic reticulum (RER) where disulfide bonds form. Proinsulin is transported to the Golgi and then to immature secretory granules where most of the proinsulin is cleaved to form A and B chains held together by disulfide bonds, and the C-peptide is released. Mature “insulin secretory granules” fuse with the plasma membrane, and mature insulin, C-peptide and a small amount of proinsulin is released outside the cell. When stimulated, beta cells secrete insulin in two phases. The first phase, which is the immediate post-meal response, begins within two minutes of nutrient ingestion. Insulin secretory granules docked to the beta cell plasma membrane are readily available to be released in this first phase. In the second phase, the undocked insulin secretory granules are part of the reserve pool and are mobilized for exocytosis and release of their contents, while additional insulin is synthesized in the beta cell. The second phase can last for several hours. The pancreas also secretes counter-regulatory hormones such as glucagon from the alpha-cells and somatostatin from the delta-cells, whose primary roles are to prevent hypoglycemia.
The control of glucose is accomplished by a closed loop feedback cycle where the glucose level directly controls the output of the insulin and counter-regulatory hormones, such as glucagon, which in turn control glucose metabolism. A rise in glucose level (after carbohydrate ingestion) stimulates insulin secretion and inhibits the output of glucagon. Food intake also stimulates somatostatin release, another counter-regulatory hormone which acts to decrease growth hormone production. Somatostatin also inhibits insulin production. Despite somatostatin’s effect on insulin production, the net effect of meal intake is to increase insulin production.
Insulin release is triggered by glucose entering the beta cell via the GLUT-2 transporter leading to an increase in ATP production. This increase in ATP inhibits ATP sensitive potassium channels, leading to membrane depolarization and calcium influx through voltage gated calcium channels. The increased intracellular calcium triggers release of insulin from the insulin secretory granules.
Insulin has several actions that result in lower blood sugar. It binds to the insulin receptor (IR) which is a receptor tyrosine kinase. The IR is a structure with two extracellular alpha subunits and two transmembrane beta subunits. Once insulin binds to the alpha subunits, the beta subunits autophosphorylate on tyrosine residues. The beta subunits are now activated. This leads to phosphorylation and activation of the insulin receptor substrate (IRS). When IRS is activated, other proteins, including PI3K, bind to IRS. PI3K will phosphorylate PIP2 to PIP3. When PIP3 concentrations increase, this leads to downstream phosphorylation events that lead to (1) increased glycogen synthesis in the hepatocytes primarily (some in the kidney) and (2) the translocation of GLUT4 transporter from intracellular vesicles to the cell membrane (in skeletal muscle primarily, but also adipose tissue). Glucose is transported into the cell. Glucose can then undergo glycolysis. At the hepatocytes, kidney and pancreas, the binding of insulin at the IR leads to the storage of glucose (which enters the cell via the GLUT2 transporter) in the form of glycogen. See table 1 for a summary of glucose transporters.
Insulin also regulates the action of enzymes that inhibit lipolysis in adipose tissue and decrease hepatic glucose output with a resultant fall in glucose concentration. Insulin is the only hormone which can effectively augment glucose utilization by insulin sensitive tissues. Furthermore, there are no mechanisms which can compensate for insulin deficiency.
| Transporter | Location | Glucose Affinity | Function | Insulin Dependence |
| GLUT1 | Most tissues | High | Provides basal glucose uptake (always active), increased expression under hypoglycemic conditions, ensures glucose delivery to glucose dependent tissues (e.g. brain, placenta) | No |
| GLUT2 | Liver, pancreatic β-cells, kidney, small intestine | Low affinity, high capacity | Acts as a glucose sensor in β-cells; facilitates bidirectional glucose transport for uptake and release (e.g., in the liver) | No |
| GLUT4 | Skeletal muscle, adipose tissue, heart | Moderate | Insulin-regulated glucose uptake; increases glucose entry into cells in response to insulin. | Yes, translocated to membrane in response to insulin |
Glucagon
A fall in glucose level (during a prolonged fast) inhibits insulin secretion and stimulates the release of glucagon from the pancreatic alpha cell. As glucose levels decrease, ATP decreases and ATP-sensitive potassium channels close. This leads to rising intracellular potassium levels and depolarization which leads to calcium influx into the cell and glucagon release.
Glucagon binds to a G-protein coupled receptor, which leads to activation of adenylyl cyclase and generates cAMP (through Gs activation) and an increase in IP3 (through Gq activation). Activation of Gs (and signaling through cAMP) is the primary mechanism by which glucagon leads to gluconeogenesis and glycogenolysis. This regulates various pathways involved in providing energy in times of starvation.
Glucagon initially stimulates the breakdown of glycogen stored in the liver, a process known as glycogenolysis. During prolonged fasting and once glycogen stores are depleted glucagon stimulates energy formation from adipose tissue and amino acids (from muscle breakdown). Glucagon promotes lipolysis and produces free fatty acids and glycerol, which is converted to glucose via gluconeogenesis. As gluconeogenesis starts to decline, free fatty acids are converted to ketone bodies, which can be used by the brain as an alternative metabolic fuel. Glucagon stimulates formation of glucose from amino acids (via gluconeogenesis) by upregulating enzymes involved in the process. Other counter-regulatory hormones include cortisol, growth hormone and epinephrine, which act through various mechanisms to increase glucose levels in response to hypoglycemia.
For the purposes of this course, glucagon can be viewed as the “anti-insulin”. In reality, please know that the interplay between glucose, insulin, glucagon, amino acids, fatty acids is much more complex. Glucagon and insulin have a very complicated interplay. This complex interplay is why both insulin and glucagon are stimulated by the presence of amino acids (as presented in the presentation).
Insulin, which is the primary hormone present in the fed state, leads to fuel storage (glucose uptake, glycogen synthesis and storage, inhibition of lipolysis and decreased hepatic glucose release). Glucagon, on the other hand, the primary hormone present in the fasted state, leads to fuel mobilization (glycogenolysis, gluconeogenesis, lipolysis and ketosis). Together these hormones act to maintain glucose levels in a very narrow normal range.
Counterregulatory Hormones
In addition to glucagon, somatostatin, growth hormone, cortisol, and epinephrine are all counterregulatory hormones that prevent hypoglycemia by opposing the actions of insulin and providing alternative fuels during times of starvation. All these hormones have insulin-antagonistic effects in the liver and peripheral tissues.
Growth hormone is secreted by the pituitary gland. Growth hormone antagonizes the effect of insulin on peripheral glucose uptake and stimulates glycogenolysis by the liver, leading to hyperglycemia. Cortisol impairs insulin secretion and leads to increased hepatic glucose output. Epinephrine increases hepatic glucose production via glycogenolysis and leads to increased blood glucose. When somatostatin is secreted by the pancreas, both glucagon and insulin secretion decrease, but the effect on insulin inhibition is stronger, leading to increase in blood sugar. Regarding timing, glucagon and epinephrine are rapid in onset, whereas cortisol and growth hormone are more delayed in their effect.
The counterregulatory hormone response to insulin deficiency (perceived state of starvation) is one of the key factors that leads to diabetic ketoacidosis (covered below).
Abnormalities in glucose metabolism
The normal pancreas has a large reserve for insulin secretion. Approximately 90% of the pancreatic function must be lost before insulin deficiency is sufficient to cause hyperglycemia. The other factor critical in the pathophysiology of diabetes is insulin sensitivity (or insulin resistance). The normal pancreas adjusts insulin secretion to match the relative insulin sensitivity of the individual. Rarely patients may have a pathologic increase in insulin or the counter-regulatory hormones, which can result in hyper- or hypoglycemia.
Hypoglycemia
Hypoglycemia is a rare condition. It can be due either to excess insulin or inadequate glucose production. Non-insulin mediated hypoglycemia is typically due to inadequate gluconeogenesis or glycogenolysis in the fasting state. This can be seen in several situations. The production of NADH from ethanol metabolism inhibits gluconeogenesis. If a person has been drinking excessive amounts of alcohol for several days with inadequate food intake, they will deplete their glycogen stores and develop hypoglycemia.
Critical illness is another common cause of hypoglycemia in hospitalized patients. In sepsis, glucose utilization is increased and can outpace glucose production leading to low blood sugars. The kidneys and liver are both sites of gluconeogenesis, so glucose production is impaired in chronic kidney disease (CKD) and liver failure, which can result in hypoglycemia, particularly in settings of poor food intake. Malnutrition often results in glycogen depletion, which limits the substrate available for generating glucose and increases the risk of low blood sugars.
Insulin mediated hypoglycemia can be due to pancreatic islet cell tumors that produce excess insulin, known as insulinomas. In these patients, insulin is produced even in cases of low glucose, ultimately resulting in hypoglycemia (blood glucose level < 70 mg/dl). These patients typically have symptoms of low blood sugars when fasting or with activity.
In both type 1 and type 2 diabetes mellitus, the most common cause of hypoglycemia is medications. Several medications will be discussed in the following chapter that can cause hypoglycemia. Exogenous insulin is the most notorious for causing hypoglycemia.
Regardless of the cause, the symptoms of hypoglycemia are similar. As glucose levels drop, counterregulatory hormones are released. Initially, there is an increase in glucagon and norepinephrine. This leads to the initial symptoms of hypoglycemia, due to increased adrenergic activity (tachycardia, palpitations, sweating, tremors) and parasympathetic activity (nausea, hunger). These symptoms often trigger the individual to treat their low blood sugar with food. Then, growth hormone and cortisol are released which cause more prolonged counter-regulatory effects on insulin action. If the adrenergic and cholinergic symptoms are missed or ignored and blood sugars continue to drop to below 50 mg/dL, patients may experience neuroglycopenic symptoms, due to inadequate glucose for normal CNS function. These symptoms include confusion, coma and seizures if hypoglycemia is left untreated. If severe hypoglycemia goes untreated, it can be fatal.
Hyperglycemia
Hyperglycemia can result from elevated levels of counter-regulatory hormones, inadequate insulin levels, as seen with type 1 diabetes, or insulin resistance, which is the primary abnormality in type 2 diabetes (discussed later in this chapter).
Glucagon is one of the primary counter-regulatory hormones, usually closely regulated in conjunction with insulin. Rarely, individuals can develop glucagonomas, which are pancreatic tumors that secrete high levels of glucagon. Elevated glucagon levels act at the liver to increase glycogenolysis and gluconeogenesis. The increased gluconeogenesis leads to high blood sugars and glucose intolerance. The increase in amino acid catabolism results in weight loss and malnutrition. Patients often present with a characteristic rash called necrolytic migratory erythema. This presents as painful and pruritic coalescing erythematous plaques involving the face, perineum and extremities.
Somatostatin is another counter-regulatory hormone that inhibits many hormones, including insulin. While most patients with somatostatin producing tumors (somatostatinomas) have no symptoms related to elevated somatostatin, up to 20% of patients will present with the classic triad of diabetes (due to inhibition of insulin production), cholelithiasis (due to inhibition of cholecystokinin (CCK) and decreased gallbladder contractility) and diarrhea.
Other endocrine abnormalities are associated with elevated counter-regulatory hormones, such as acromegaly (elevated growth hormone), Cushing’s syndrome (elevated cortisol) and pheochromocytoma (elevated metanephrines, including the clinical analytes metanephrine and normetanephrine, derived from epinephrine and norepinephrine, respectively). Hyperglycemia is a common symptom with all these conditions.
Diabetes Mellitus
Definition
Diabetes mellitus is defined as fasting or post-meal hyperglycemia due to absolute or relative insulin deficiencies. In the most simplistic terms, there are two types of diabetes mellitus: type 1 and type 2. In reality, there are many different causes of diabetes. Type 1 and type 2 diabetes will be covered in detail in this course. While type 1 diabetes is a condition of pure insulin deficiency due to destruction of pancreatic beta cells, type 2 diabetes is a condition of relative insulin deficiency due to resistance to the effects of insulin.
Insulin Resistance
Insulin resistance can be defined as a state in which a normal amount of insulin produces a subnormal biologic response. Insulin resistance can occur at several points in the insulin signaling pathway. Normally, insulin binds to its receptor on muscle or adipose tissue which initiates a signaling cascade that eventually results in increased glucose uptake via translocation of GLUT4 to the cell surface. Abnormalities before insulin’s interaction with the cell are termed pre-receptor defects. These include binding of insulin by antibodies, increased degradation of insulin, and molecular abnormalities in the structure of the insulin molecule which make it difficult for insulin to bind to its receptor. These causes of insulin resistance are uncommon in type 2 diabetes.
At the receptor level, chronically elevated insulin levels lead to downregulation of the insulin receptors. While this does contribute to insulin resistance associated with obesity and high carbohydrate intake, it is not a major contributor to insulin resistance in type 2 diabetes.
Abnormalities in insulin receptor signaling, known as post-receptor defects, are the primary cause of insulin resistance in type 2 diabetes. Adipokines, signaling molecules produced by adipose tissue such as TNF-α and IL-6, inhibit insulin signaling through various mechanisms. This includes tyrosine phosphatases that dephosphorylate the insulin receptor, inhibitors that block the receptor-IRS interaction, and serine kinases that inhibit the receptor activity by phosphorylating serine, rather than activation via tyrosine phosphorylation.
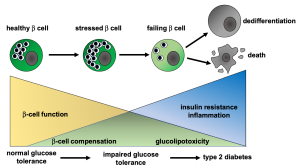
In the initial phases of insulin resistance, the beta cells produce more insulin in order to overcome the insulin resistance. In the early phases of insulin resistance, glucose levels are normal and insulin levels are high (due to increased insulin production and beta-cell proliferation). As insulin resistance progresses (Fig 1), the beta cells become stressed and decompensate, and this will lead to higher blood sugars. Type 2 diabetes or pre-diabetes may be diagnosed at this time. Ongoing hyperglycemia (and high lipid levels) lead to eventual beta cell failure and chronic type 2 diabetes mellitus.
Risk Factors for the Development of Insulin Resistance and Type 2 Diabetes
Type 2 diabetes results from insulin resistance (relative insulin deficiency) which is typically caused by post-receptor defects of the insulin receptor signaling pathways. Type 1 diabetes results from absolute insulin deficiency.
It is important to recognize which patients are at higher risk of developing type 2 diabetes. Type 2 diabetes also has a strong genetic component. Genetics of type 2 diabetes are a classic polygenic inheritance with dozens of genes each conveying a small amount of additional risk. Major advances have been made in the identification of genetics around type 1 and type 2 diabetes in the last decade (Endocrine Reviews, December 2019, 40(6):1500–1520). Even though identical twins have a concordance rate of nearly 100%, the exact genomic defects are still not known. There are likely several abnormalities responsible for the beta cell defects and insulin resistance seen in these individuals.
Multiple environmental factors contribute to a patient’s risk for the development of type 2 diabetes. This includes the effects of racism and discrimination. Some of these factors are modifiable, while others are not. Humans are genetically selected to survive starvation. In settings of relative food abundance however, this trait is maladaptive and leads to increased body fat. Since excess adipose tissue is closely tied to type 2 diabetes, individuals who are dependent on calorie dense, low-cost foods are at higher risk of developing obesity and thus type 2 diabetes.
Often due to structural racism and implicit bias, food insecurity is more prevalent among some populations, which may lead to suboptimal nutrition in pregnancy. Low birth weight, due to fetal malnutrition, can irreversibly affect a child’s metabolism. The fetus may switch on genes during development to maximize energy conservation. The baby will be more prone to increased fat deposition and weight gain, and when exposed to an environment of relative caloric abundance, may be more prone to obesity. This also increases risk of developing type 2 diabetes and explains some of the difference in diabetes risk in different populations.
Social and environmental factors also play a strong role in the higher rates of diabetes in populations at risk and affect an individual’s self-management of their disease. A person’s physical environment, including access to transportation and safety of their neighborhood, their economic stability, education level, access to and opinion of the health care system (how an individual experiences the health care system including implicit bias and structural racism), as well as their community support all influence health outcomes.
It is important to recognize that while patients may be at higher risk of both pre-diabetes and type 2 diabetes, it may be social determinants of health that cause this increased risk. Rather than using race or ethnicity to determine diabetes risk, assessing for social determinants of health in all patients can help identify additional areas for intervention, at the individual and community levels, which can help decrease the risk for diabetes in all patient populations. However, the most recent guidelines from the American Diabetes Association do use ethnicity as a criterion for screening. In their explanation of this, they note that people of color have a higher rate of undiagnosed diabetes for multiple reasons. Because of this recommendation, screening is crucial to ensure early diagnosis.
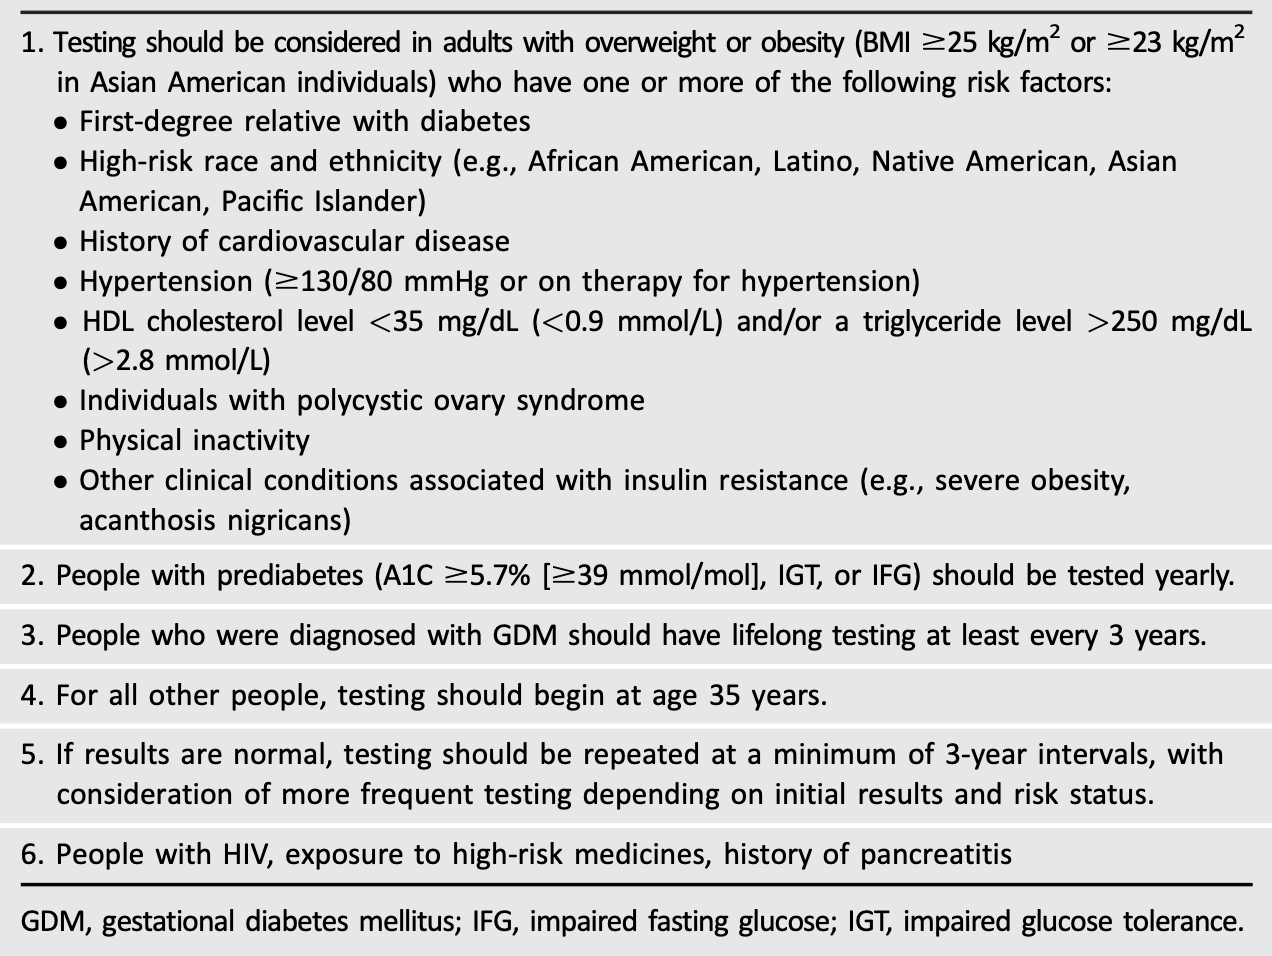
Risk factors for insulin resistance and pre-diabetes include a history of polycystic ovary syndrome, gestational diabetes, obesity and a family history of type 2 diabetes. Individuals that meet these criteria should be screened for type 2 diabetes. In addition, people with cardiovascular disease, a sedentary lifestyle, hypertension and elevated triglycerides should also be screened for pre-diabetes (Table 2). The USPSTF (United States Preventative Services Task Force) recommends screening for diabetes in all non-pregnant adults ages 35 – 70 years old who have overweight (BMI>25) or obesity (BMI>30). The American Diabetes Association (ADA) recommends screening all adults > 35 years old. Screening should be repeated every three years when results are normal. In addition to the age criteria, the ADA recommends testing for prediabetes or type 2 diabetes in asymptomatic people with overweight or obesity who have one or more risk factors detailed in Table 1 (Section 1).
Endocrine Disrupting Chemicals
Direct Effects on Insulin-Producing Cells
EDCs can impair the ability of the pancreas to produce insulin by directly targeting beta cells. Compounds like bisphenol A (BPA) and arsenic have been shown to reduce beta cell numbers, impair insulin secretion, and disrupt mitochondrial function. This leads to oxidative stress and a decline in insulin output, a hallmark of both Type 1 and Type 2 diabetes.
Indirect Effects on Insulin Sensitivity and Glucose Metabolism
Many EDCs contribute to obesity, a key risk factor for insulin resistance. They may upregulate genes that promote fat accumulation and adipocyte differentiation, and alter enzymes involved in lipid metabolism. This metabolic disruption makes peripheral tissues like the liver less responsive to insulin, impairing the body’s ability to regulate blood glucose levels efficiently.
Disruption of Hormone Signaling and Metabolism
Beyond insulin, EDCs can disturb the broader hormonal network. They interfere with thyroid hormones and cortisol, both of which play crucial roles in metabolism and stress responses. Disruption of thyroid hormone signaling can slow metabolism, while altered cortisol levels may exacerbate insulin resistance. Additionally, many EDCs promote chronic inflammation and oxidative stress, which further impairs insulin signaling pathways.
Examples of Specific EDCs
-
Bisphenol A (BPA): Alters beta cell function and impairs insulin secretion.
-
Arsenic: Induces oxidative stress in beta cells and disrupts glucose homeostasis.
-
Phthalates and organotins: Promote adipogenesis and may impair insulin sensitivity.
-
Polychlorinated biphenyls (PCBs): Disrupt thyroid hormone signaling and metabolic regulation.
Diagnosis of Diabetes Mellitus and Pre-Diabetes
Hyperglycemia forms the basis for the clinical diagnosis of diabetes. According to the most recent diagnostic criteria, if one of the following is present, the diagnosis of diabetes can be made (Table 3): fasting plasma glucose > 126 mg/dL, a random plasma glucose > 200 mg/dL associated with symptoms of diabetes, an abnormal oral glucose tolerance test (OGTT), or a hemoglobin A1C (HbA1c) >6.5%. An OGTT involves consumption of 75 grams of glucose with sampling of blood glucose prior to ingestion of the glucose and 2 hours after ingestion. Individuals with values above 200 mg/dL at 2 hours have diabetes. HbA1c, which is a surrogate for average blood sugar, can be used as an alternative to blood glucose to diagnose diabetes. Generally, if a patient has a positive result on one test, that test (or another) should be repeated to confirm the diagnosis.
Glucose abnormalities exist on a continuum. People may have blood sugar values that are above normal, but don’t meet the diagnostic criteria for diabetes. These people are considered to have “pre-diabetes.” Pre-diabetes is important to recognize, as it is associated with an increased risk of cardiovascular disease, and nearly 30% of patients with pre-diabetes will progress to type 2 diabetes over 5 years. It is important to intervene early to prevent both type 2 diabetes and associated cardiovascular disease.
The diagnostic criteria described below are used for all types of diabetes (type 1, type 2 and other types)
|
Diagnosis |
Hemoglobin A1C |
Fasting Blood Glucose |
Oral glucose tolerance test (OGTT) at 2 hour post-prandial |
Random Blood Glucose |
|
Diabetes |
>6.5% |
>126 mg/dL |
>200mg/dL |
>200 mg/dL* |
|
Pre-diabetes |
5.7 – 6.4% |
100 – 125 mg/dL |
140 – 199 mg/dL |
N/A |
|
Normal |
< 5.7% |
<100 mg/dL |
<140 mg/dL |
N/A |
| *with symptoms of hyperglycemia | ||||
Type 2 Diabetes Epidemiology
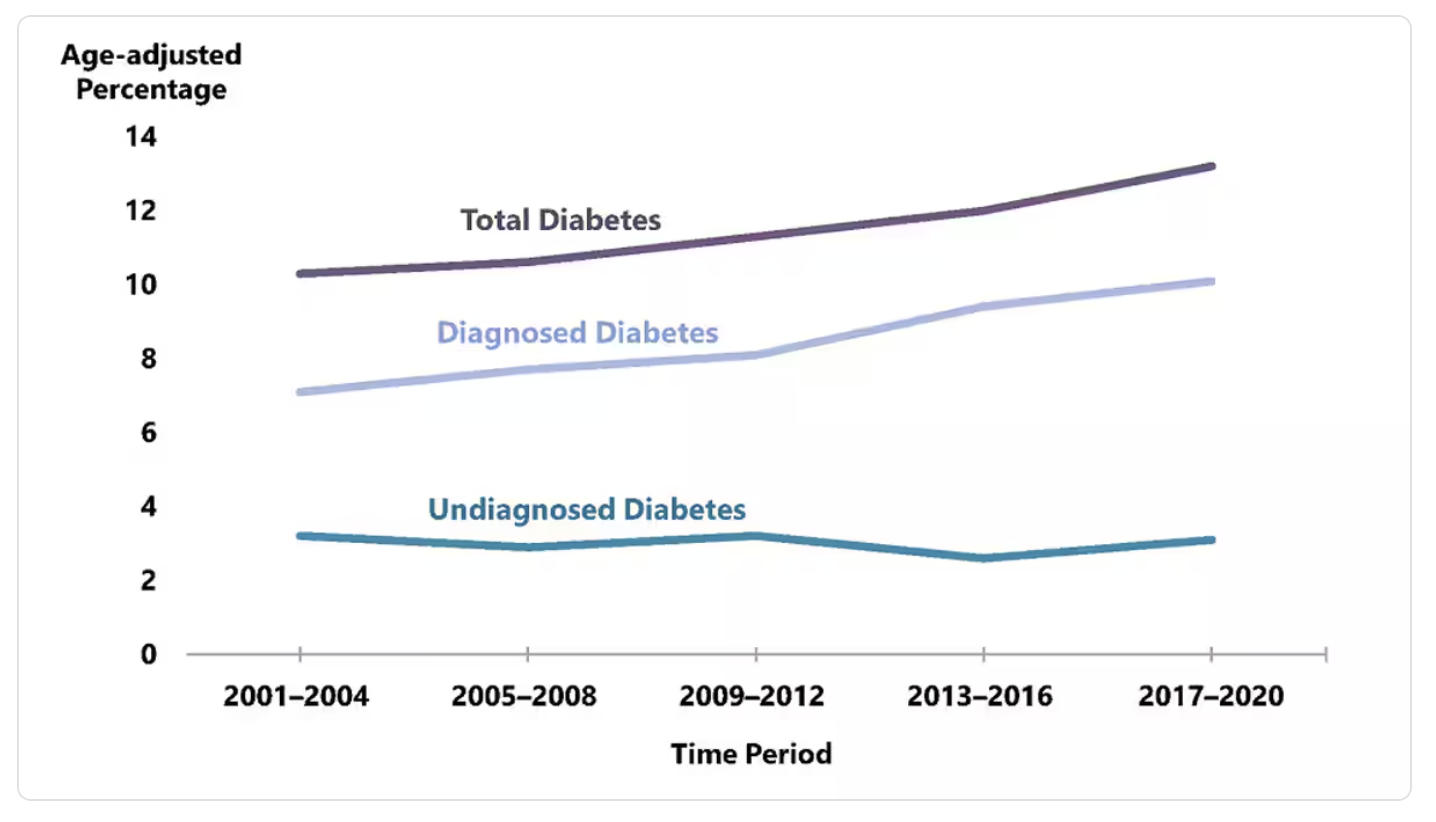
Pre-diabetes is exceedingly common. According to the CDC (using crude estimates from 2021), 97.6 million people aged 18 years or older have prediabetes (38% of the adult U.S. population). 27.2 million people aged 65 years or older (48.8%) have prediabetes. Most people do not know they have pre-diabetes. 70% of individuals with pre-diabetes will go on to develop type 2 diabetes. Diabetes is the eigth leading cause of death in the United States. Among U.S. adults aged 18 years or older, crude estimates for 2021 indicate 38.4 million people of all ages, 11.6% of the U.S. population had diabetes. 8.7 million adults who met laboratory criteria for diabetes were not aware or did not report having diabetes (undiagnosed diabetes), this represents 22.8% of all U.S. adults with diabetes. Most of all diagnosed cases of diabetes in the US are type 2 diabetes (90-95%). Diabetes prevalence (the total number of existing cases) has increased steadily 2001 – 2020 (Figure 2). The annual incidence (new cases of diagnosed diabetes) has decreased since 2009 through 2020. The increasing prevalence is due in part to people living longer with diabetes.
Members of some racial and ethnic groups are more likely to have diagnosed diabetes. American Indian or Alaska Native adults have the highest rates of diagnosed diabetes among all US racial and ethnic groups, followed by Hispanic people and non-Hispanic black people. Differences in diabetes prevalence is also seen between different education levels, with lower education levels being associated with increased prevalence of diabetes. Most of these differences are due to effects of racism, implicit bias, and socioeconomic barriers. Social determinants of health are foundational issues that impact health.
Prevention of Type 2 Diabetes
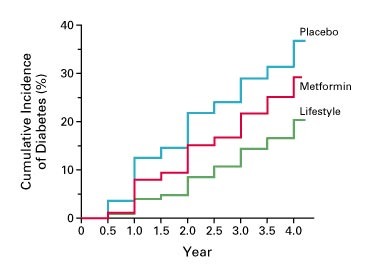
A mainstay in management of pre-diabetes is to prevent the development of type 2 diabetes. The diabetes prevention program (DPP) was a 27-center randomized controlled trial (RCT) to determine whether lifestyle intervention or pharmacologic therapy would prevent or delay the onset of diabetes in people with pre-diabetes. Data from the DPP showed that both lifestyle modification and metformin (a drug used to treat both diabetes and prediabetes) delayed the incidence of diabetes (Figure 3). Lifestyle modification was more effective. The lifestyle modification arm involved a weight loss goal of 7% and 150 minutes of moderate physical activity. Although lifestyle modification is a key component of diabetes management and prevention, focusing on the behavior of the individual ignores the societal influences that affect an individual’s disease state. As discussed in previous sections, numerous factors, including societal and environmental factors, can have an impact of an individual’s risk from chronic disease, and unless these factors are taken into consideration, long lasting benefits from lifestyle modification are difficult to come by. Thus, many patients require pharmacologic therapy as well. Since the DPP RCT, the National Diabetes Prevention Program is a partnership of public and private organizations working to prevent or delay type 2 diabetes.
Clinical Features of Type 2 Diabetes and Pathogenesis of Hyperglycemia
The clinical features of type 2 diabetes may be present for years prior to diagnosis. Clinical signs of insulin resistance, such as acanthosis nigricans, can be present prior to diagnosis. Family history of type 2 diabetes is an important part of history that may provide clues to diagnosis. As blood sugars rise, people will present with classic symptoms of hyperglycemia: excess thirst, excess urination, frequent urinary tract infections or genital yeast infections. Due to the chronicity of hyperglycemia prior to diagnosis, people may present with complications (to be discussed in the next chapter) at the time of diagnosis. Occasionally, people with type 2 diabetes can develop severe hyperglycemia (which can lead to hyperosmolar hyperglycemic state (HHS)). Severe hyperglycemia in type 2 diabetes is caused by relative insulin deficiency (which occurs with hyperglycemia). HHS presents with severe hyperglycemia (>600 mg/dL), volume depletion, and altered mental status. Ketone formation is typically absent in HHS (which helps distinguish from the severe hyperglycemia seen in type 1 diabetes, which will be discussed below).
Insulin resistance over many years eventually leads to beta cell stress and failure, which leads to hyperglycemia. As insulin activity decreases, there are several mechanisms that lead to hyperglycemia. There are eight main causes of hyperglycemia in people with type 2 diabetes.
- Decreased insulin secretion – years of beta-cell stress from insulin resistance leads to reduction in insulin secretion.
- Increased glucagon secretion – due to insulin resistance, the alpha-cell (and other tissues) perceive a state of glucose deficiency. The alpha-cell secretes glucagon in response to this leading to increased gluconeogenesis and glycogenolysis further increasing glucose levels.
- Increased hepatic glucose output – due to insulin resistance, the peripheral tissues perceive a state of glucose deficiency. In response to this and due to increased glucagon, the liver increases glucose output via glycogenolysis and gluconeogenesis.
- Neurotransmitter dysfunction – insulin is an important appetite suppressant. In states of insulin resistance, the appetite suppressing effects at the hypothalamus are impaired.
- Decreased muscular glucose uptake – Insulin deficiency and resistance impair muscle glucose uptake.
- Increased glucose resorption at the kidney – due to insulin resistance, the peripheral tissues perceive a state of glucose deficiency. In response to this the kidneys reabsorb glucose into the blood stream instead of excreting it.
- Increased lipolysis – Abnormal adipocyte metabolism and altered fat topography are both important in the pathogenesis of glucose intolerance in type 2 diabetes. 1) Due to insulin resistance, fat cells (adipocytes) are resistant to insulin’s anti-lipolysis effect leading to chronic elevation in free fatty acids (FFA). 2) Chronically increased FFA levels stimulate gluconeogenesis, induce hepatic/muscle insulin resistance, and impair insulin secretion. These FFA-induced disturbances are referred to as lipotoxicity. 3) Dysfunctional fat cells produce excessive amounts of insulin resistance–inducing, inflammatory, and atherosclerotic-provoking adipocytokines and fail to secrete normal amounts of insulin-sensitizing adipocytokines such as adiponectin.
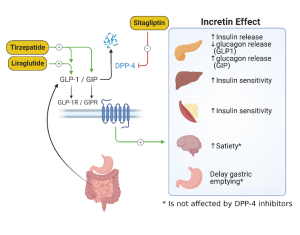
- Decreased incretin effect – The impaired response of incretin hormones is an important mechanism behind the development of hyperglycemia and provide an important pharmacologic target for management of type 2 diabetes. In a normal state, after meal ingestion the incretin hormones (GLP-1 and GIP) stimulate release of insulin from the pancreas, aiding in the regulation of post-meal blood glucose. In type 2 diabetes, the incretin response is blunted which leads to increased post-prandial glucose levels, and increased glucagon which results in hyperglycemia.
Management of Type 2 Diabetes
Lifestyle Intervention
The primary treatment for pre-diabetes and diabetes is focused on lifestyle changes. While pharmacotherapy can improve insulin sensitivity (metformin and thiazolidinediones have both been shown to be effective; both are discussed in more detail below), lifestyle changes have a more significant impact on blood sugars, as shown by the Diabetes Prevention Program (DPP). Weight loss and activity increase glucose uptake by peripheral tissues and decrease post-prandial hyperglycemia. The ability to implement lifestyle modification is not equitable across all communities, with BIPOC experiencing greater risk of health disparities due to these inequities.
Pharmacology
In the United States as of October 2017, there were 8 different drug classes, consisting of 47 different medications approved for the treatment of type 2 diabetes. Since then, 3 additional medications have been approved by the FDA. Prior to 1995 only two classes of drugs were available: sulfonylureas and insulin. There has been a significant expansion of new diabetes medications to the market, which gives physicians and patients more options for managing blood sugars with fewer side effects, but often at significant financial cost. We will review the most used drug classes here.
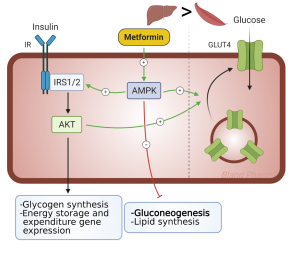
Metformin is recommended as first line therapy for all patients with type 2 diabetes, who do not have contraindications to the medication. Metformin by itself does not cause hypoglycemia as it does not stimulate insulin secretion. The mechanism of action is to decrease hepatic glucose production (Figure 4) and stimulate peripheral glucose disposal at the muscle. It belongs to the class of drugs called biguanides and is the only agent of this class available in the United States. This drug has been available for several decades yet was only introduced in the United States in early 1995. The main reason for this delay to market was the concern for potentially fatal lactic acidosis. This did occur more frequently with another biguanide, phenformin, which was taken off the market in the United States in 1977. This side effect is uncommon with metformin as long as it is not given to patients with impaired renal function. More common side effects are related to the gastrointestinal system: diarrhea, nausea, and vomiting. These can be minimized by starting at low doses, working up to higher doses slowly, and taking the drug with food. Metformin results in ~1.5-2% decrease in HbA1c. It does not cause weight gain. Because of its safety, efficacy, cost, and lack of weight gain, metformin is considered first line therapy for those with Type 2 diabetes. The medication can be combined with many other diabetes medications.
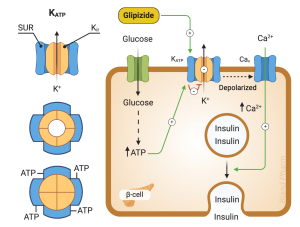
Sulfonylureas have been used for the treatment of type 2 diabetes since the 1960s. Sulfonylureas act primarily by stimulating insulin secretion. These drugs bind to an area of the beta cell plasma membrane associated with ATP-dependent K+ channels referred to as the sulfonylurea receptor (Figure 5). When sulfonylureas bind to their receptor, they close ATP-dependent K+ channels. This is the same channel that is inhibited by the rise in ATP after glucose entry into cells. The decrease in K+ permeability depolarizes the membrane and opens voltage dependent Ca2+ channels leading to an increase in intracellular calcium. This increase in calcium leads to exocytosis of insulin-containing secretory granules.
Sulfonylureas increase endogenous insulin secretion, so are ineffective in patients with type 1 diabetes who are incapable of insulin secretion. They are generally well tolerated. The most common side effect is hypoglycemia which is more common in the elderly, in those with impaired renal function, and when mealtimes are delayed. They can also cause weight gain. They are among the lower cost options for diabetes management.
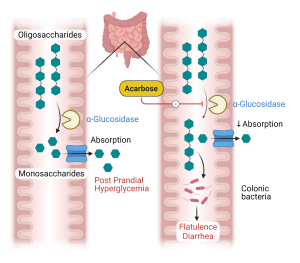
Alpha glucosidase inhibitors. The first drug of this class, acarbose, was introduced into the United States in 1996. Acarbose reversibly and competitively inhibits alpha-glucosidases of the intestinal brush border, enzymes which use starch and other polysaccharides as their substrate (Figure 6). Acarbose delays the digestion of ingested carbohydrates, thereby resulting in lowered peak postprandial blood glucose levels. This reduction is substantial enough to lower HbA1c levels by 0.5-1.0%. As monotherapy, hypoglycemia cannot occur since insulin is not stimulated. The major adverse events are related to the gastrointestinal tract. The delivery of undigested carbohydrate to the large bowel, with the associated fermentation by gut results in the predicted flatulence and gaseous distention of the colon which limits the use of these medications as many patients cannot tolerate the side effects. As they do not require a functional beta cell for their effect, they theoretically would be effective for both type 1 and type 2 diabetes. They have also been shown to be effective in preventing the progression of pre-diabetes to type 2 diabetes.
Thiazolidinediones. The first of these agents, troglitazone, was introduced into the United States in 1997. It was subsequently withdrawn from the market in the United States in early 2000 due to rare but potentially fatal liver toxicity. The two newer thiazolidinediones, rosiglitazone and pioglitazone, were released in the summer of 1999. Thiazolidinediones increase the sensitivity of target tissues to insulin through binding to peroxisome proliferator activated receptors (PPAR) that regulate the transcription of a number of insulin responsive genes critical to glucose and lipid metabolism, including adiponectin. This improves insulin sensitivity. They do not increase insulin levels and hypoglycemia will not occur. Edema, weight gain, and osteoporosis are side effects of the TZDs, due to actions of PPAR gamma in other tissues. They lead to increase differentiation of adipocyte precursors to mature adipocytes, leading to increased fat mass. They also increase bone turnover, leading to osteoporosis. They are contraindicated in congestive heart failure due to the side effect of edema. Pioglitazone has been linked to bladder cancer and has been withdrawn from the market in France and Germany due to this risk. A study in 2007 suggested there was an increased risk of cardiovascular mortality with rosiglitazone, leading the drug being withdrawn from the market in Europe and US. Re-analysis of the data showed no increased risk, so rosiglitazone is again available in the US, although not frequently used.
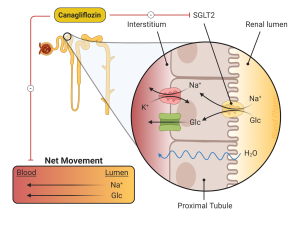
Sodium Glucose Transporter-2 (SGLT-2) inhibitors. Three agents, canagliflozin, empagliflozin, and dapagliflozin, are approved for use in this class. The SGLT-2 inhibitors work by inhibiting SGLT-2, a transporter located in the proximal tubule of the kidney responsible for reabsorbing glucose. (Figure 7) By inhibiting this transporter, glycosuria ensues, resulting in a lowering of blood glucose and weight loss. There is no risk of hypoglycemia when used as monotherapy. The glycosuria does increase the risk of genital mycotic infections, especially in women. SGLT-2 inhibitors also lead to lower blood pressure, due to their diuretic affect, which can be beneficial for patients with hypertension, but can cause volume depletion in others. SGLT-2 inhibitors improve renal and cardiovascular outcomes in people with type 2 diabetes. SGLT-2 inhibitors are indicated in people with type 2 diabetes, regardless of blood sugar, who have renal disease if urine protein is >200mg/g. However, SGLT2 inhibitors should not be initiated in people with eGFR < 20 mL/min/1.73m2. Although use of SGLT2 inhibitors will lead to improvement in renal function with eGFR from 45 to 20, they don’t typically have significant effect on blood sugars with eGFR < 45 mL/min/1.73m2.
Several rare complications of SGLT-2 inhibitors have been described. The first is “euglycemic” diabetic ketoacidosis, meaning patients develop DKA with blood sugars generally <250 mg/dl. The absence of significant hyperglycemia often delays the diagnosis. In addition to lowering glucose levels, the SGLT-2 inhibitors increase glucagon levels. For individuals who have deficient insulin production, this can result in a low insulin with high glucagon which can lead to diabetic ketoacidosis (to be described in the next chapter). This is most common in patients with type 1 diabetes, who are using the SGLT-2 inhibitors “off-label” but can be seen in patients with advanced type 2 diabetes and decreased insulin secretion. Patients should be encouraged to check urine ketones in the setting of nausea and vomiting, with discontinuation of the medication if acidosis is confirmed.
Studies of canagliflozin found an increased risk of amputation in patient taking the medication compared to placebo, confirmed on review of post-marketing data. There was previously a black box warning placed by the FDA alerting providers to increased amputation risk. This black box was removed in August 2020. Safety information from recent clinical trials suggests that the risk of amputation, while still increased with canagliflozin, is lower than previously described.
Incretins are intestinal hormones which result in insulin secretion in response to oral glucose. This effect is estimated to be responsible for 50 to 70% of the insulin response to glucose and is caused mainly from two insulin-stimulating hormones, glucagon-like peptide-1 (GLP-1) and glucose-dependent insulinotropic polypeptide (GIP). As described above, GLP-1 secretion is deficient in patients with type 2 diabetes, and thus GLP-1 mimetics (liraglutide, semaglutide, dulaglatide) have been developed for the treatment of type 2 diabetes. In addition to their actions on insulin secretion, GLP-1 receptor agonists also act to suppress postprandial glucagon release, delay gastric emptying, and suppress appetite which leads to weight loss in most patients (Figure 8). Studies of cardiovascular (CV) outcomes have had mixed results, with most GLP-1 agonists associated with a reduction in CV events. There is no increase in CV risk with this class of medications. Newer agents have recently been released that are co-agonists for GLP-1 and GIP (tirzepatide) which have more powerful glucose lowering and weight lower effects compared to agents that are only GLP-1 receptor agonists.
The major side effect of the GLP-1 and GIP agonists is nausea. Acute pancreatitis has been described with the GLP-1 receptor agonists, but unclear if there is a causal relationship. There are currently several GLP-1 receptor agonists available in the US. The primary difference between the various medications is dosing frequency. Some are twice daily, some once daily and several can even be given once weekly.
Normally, GLP-1 is quickly degraded by the enzyme dipeptidyl-peptidase IV (DPP-IV). Inhibiting this enzyme prolongs the duration of action of endogenous GLP-1 and provides another pharmacologic target for treatment of type 2 diabetes. The first oral inhibitor of DPP-IV, sitagliptin, was released in 2006. Saxagliptin was approved in 2009, and linagliptin in 2011. As monotherapy, these agents do not appear to be as efficacious as the other oral agents (eg. Metformin), lowering HbA1c by 0.5%. However, in combination with other oral agents HbA1c reduction is usually 0.7-1.0%.
To date, no serious side effects have been noted with DPP-IV inhibitors, thus are a good option for patients who have side effects with other medications. There may be an increased risk of acute pancreatitis with the DPP-IV inhibitors, but there is insufficient data to know if there is a causal relationship. These drugs are weight neutral, meaning they do not cause weight gain but are not associated with weight loss. Unlike the GLP-1 receptor agonists, they do not cause nausea. They are safe to use in renal insufficiency.
Insulin is commonly used to treat type 2 diabetes, especially in later stages of type 2 diabetes. Insulin will be covered below in the section on type 1 diabetes.
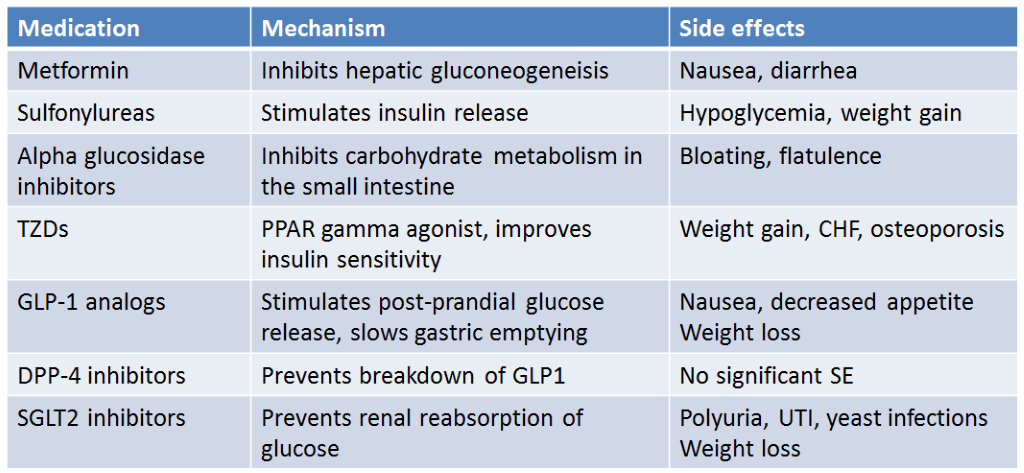
The most used non-insulin medications for the treatment of type 2 diabetes are summarized below (Table 4).
Type 1 diabetes mellitus
Type 1 diabetes is a condition of pure insulin deficiency. It is an autoimmune condition, with autoantibodies directed at the islet cells, resulting in destruction of the insulin-producing cells of the pancreas. Type 1 diabetes has its peak age of presentation during adolescence (although it may present at any age), symptoms are usually severe and abrupt in onset, and if not treated with insulin, the disease is fatal due to ketoacidosis. The time course from the beginning of hyperglycemia to ketoacidosis to death may be variable. Prior to the discovery of insulin, most children died shortly after diagnosis. Type 1 diabetes presenting during the adult years often has a less dramatic presentation due to a slower autoimmune process of beta cell destruction. These individuals may be difficult to classify at time of initial diagnosis. They are often mischaracterized as having type 2 diabetes.
Pathogenesis of Type 1 diabetes
The pathogenesis of type 1 diabetes involves both genetic predisposition and an autoimmune attack on beta cells. Although the clinical presentation is relatively acute with symptoms for only weeks to several months prior to diagnosis, beta cell destruction occurs over a much longer period. Most individuals become hyperglycemic only when very little beta cell reserve remains.
There is no identifiable pattern of inheritance with type 1 diabetes, and most cases occur in the absence of any family history. A major genetic determinant resides within the human leukocyte antigen (HLA) region on the short arm of chromosome 6. Beta cell destruction in type 1 diabetes is immunologic in nature. Lymphocytes infiltrate the islet cells, with both antibodies and T-cells directed against islet antigens present in the blood. These antibodies are frequently present years prior to the diagnosis of type 1 diabetes. Five of these antibodies: islet cell antibody (ICA), islet cell antibody 512 (ICA-512, also termed IA-2), insulin autoantibodies (IAA), antibodies to glutamic acid decarboxylase (GAD), and zinc transporter antibodies (ZnT8) have been shown to have predictive value for the subsequent diagnosis of clinical type 1 diabetes. Whereas ICA-512 may be the most predictive antibody for the development of type 1 diabetes for young children, the antibody to GAD seems to be more predictive in adults. Having two or more antibodies confers an even higher risk.
Clinical presentation
The symptoms of diabetes are initially due to hyperglycemia. As blood sugar levels rise above 180 mg/dl, they exceed the plasma renal threshold for glucose reabsorption. This leads to glucosuria, an osmotic diuresis, which presents as polyuria and volume depletion. Hypovolemia and hyperglycemia together result in increased plasma osmolality, which leads to increased thirst. Patients may note weight loss, due to hypovolemia and increased catabolism, despite increased food intake. If left undiagnosed, patients may progress to severe hyperglycemia and diabetic ketoacidosis.
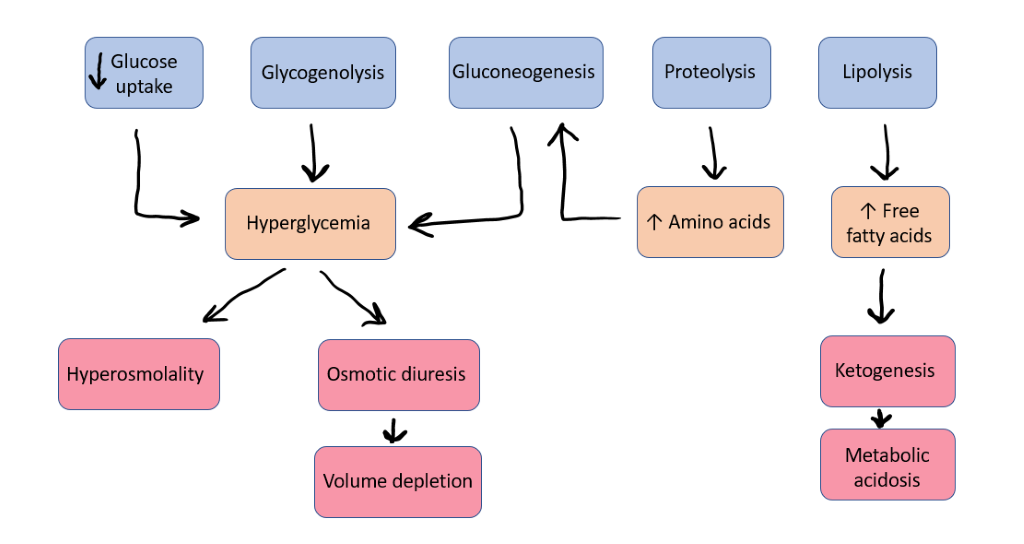
Hyperglycemia as described above causes osmotic diuresis and volume depletion. This results in further elevation of counter-regulatory hormones, further increasing the drive for glucose and ketone production. Eventually, a vicious cycle develops: excess counterregulatory hormones lead to worsening insulin resistance and further hyperglycemia which causes more severe volume depletion (Figure 9). Full DKA can develop in a few hours to a few days. The critical components of DKA are ketonemia, ketonuria, and hyperglycemia. Acetone, acetoacetate, and ß-hydroxybutyrate are the ketone bodies which accumulate. Acetone is an inert, volatile gas, but acetoacetate and ß-hydroxybutyrate are acid anions and their accumulation results in metabolic acidosis.
Volume repletion to treat hypovolemia and hyperosmolality associated with DKA is crucial, as is insulin replacement. Insulin deficiency can cause extracellular shifts of potassium, and many patients will have hyperkalemia at presentation. It is important to recognize however, that despite normal or high serum potassium in DKA, the increased potassium is due to shift from the intracellular to extracellular space in response to systemic acidosis, GI losses and volume loss associated with osmotic diuresis. This actually results in significant total body potassium depletion despite the hyperkalemia (or normal potassium) often seen on blood work. Potassium replacement must be started early to avoid hypokalemia as insulin is replaced and acidosis is corrected. corrected. Furthermore, once blood glucose level decreases during management of DKA, glucose may be administered along with insulin to avoid hypoglycemia as the patient is rehydrated and the electrolyte balance is returned to normal. It is also important to identify any underlying illness that may have triggered DKA and treat those appropriately.
Treatment of Type 1 Diabetes: Insulin Options
Insulin is the only means of treating type 1 diabetes. Prior to the discovery of insulin in 1922, the diagnosis of type 1 diabetes was fatal. The initial insulin available in 1922 was crude by today’s standards. It contained many impurities which resulted in frequent allergic reactions and numerous skin problems such as lipoatrophy (severe atrophy in the area of injection) and sterile abscesses. The only insulin available for more than a decade after its discovery was “soluble” or “regular” insulin. Furthermore, all the insulin produced for the first 60 years after its discovery came from animal sources, bovine and porcine. Insulins currently available are synthetic human insulins, with the introduction in 1996 of the first of many “insulin analogs” (modified versions of human insulin).
More recently, ultra-short acting insulins have become available. These insulins (Fiasp® and Lyumjev®) are slightly faster acting than traditional fast-acting insulin and claim to offer more dosing options around mealtimes due to the faster onset of action. Fiasp® is insulin aspart but the formulation contains the addition of Vitamin B3 (niacinamide) and an amino acid (L-Arginine), to stabilize the formulation. Lyumjev® is insulin lispro-aabc. The “aabc” is used to refer to the two additives that make this insulin more rapid acting than insulin lispro.
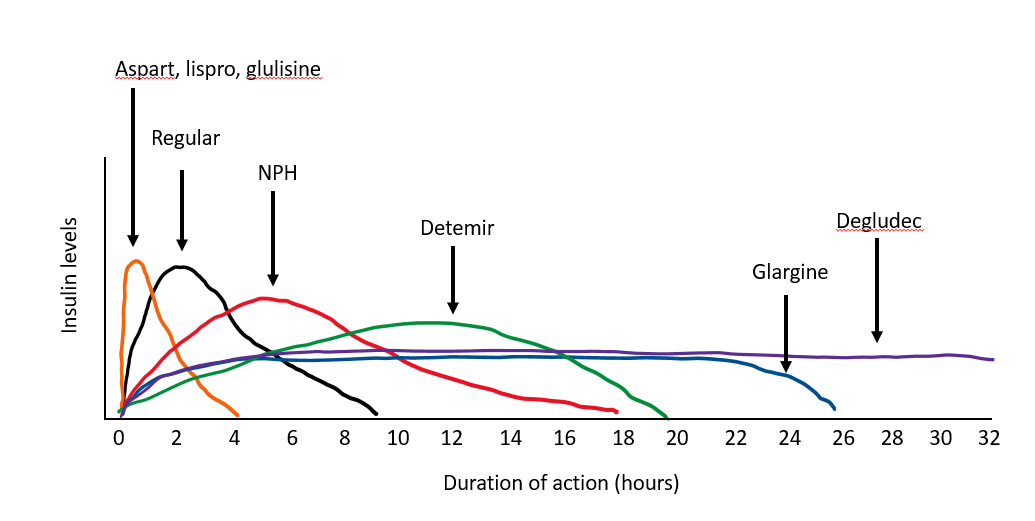
Intermediate-acting insulin. NPH insulin is an intermediate insulin preparation. The NPH stands for Neutral (its pH), Protamine, and Hagedorn (the discoverer). Both protamine and zinc bind to insulin to delay its absorption, so it has a longer duration of action than regular insulin. It lasts about 12 hours, with a peak in activity 4-6 hours after injection. The primary benefit of NPH insulin is its low cost compared to the analog insulins.
Afrezza® is an inhaled insulin. The time to first measurable effect is 12 minutes and the effect peaks within 30-60 minutes. This is significantly shorter than even ultra-rapid acting insulins (which have first measurable effect around 20 minutes). Inhaled insulin comes in 4 – 12 unit cartridges and is considered less potent than injectable insulin. Based on clinical trials, a 1.5x conversion from injectable insulin units to inhaled insulin units is recommended to achieve a comparable glucose effect. People with underlying lung conditions should not use inhaled insulin. Monitoring lung function with pulmonary function testing prior to initiation and periodically while using inhaled insulin is necessary. Two percent of patients experienced >20% decline in FEV1 from baseline in clinical trials.
Treatment of Type 1 Diabetes: Using Insulin
Insulin can be used to treat type 1 diabetes or type 2 diabetes. Physiologic insulin replacement (also known as “basal – bolus” insulin therapy) is often prescribed to people with type 1 diabetes or those with type 2 diabetes with more advanced beta cell loss. For this type of replacement, an intermediate- or long-acting insulin must be administered daily with a rapid-acting insulin before meals. The strategy is to try to replicate a nondiabetic pancreas. The intermediate and long-acting insulins are used as “basal” insulins to control fasting hyperglycemia, while the rapid acting “bolus” insulins are generally used for glucose excursions associated with meals. Due to the difficulties in predicting insulin absorption and the imperfections of subcutaneous insulin administration in general, our attempts are far from perfect. Consistency with mealtimes, meal composition, and exercise makes this less problematic. With frequent home blood glucose monitoring, patient education regarding how to make changes in an individual regimen (including diet and exercise), and an insulin regimen allowing some flexibility in mealtimes and food composition, it is now possible to maintain blood glucose levels in the goal target range (70-180mg/dL) most of the time.
Hypoglycemia is a dreaded complication in those who use insulin. It can be unpredictable and life-threatening. For this reason, synthetic glucagon should be prescribed to all people who are taking insulin. Glucagon is emergency treatment that is used in the management of severe hypoglycemia when rapid-acting carbs are ineffective or if an individual is unable to consume carbohydrates. Glucagon comes as an injection or a nasal spray. The maximal glucose concentrations occur 5 to 20 minutes after administration of glucagon. Directions to carry the glucagon kit with them at all times should be given. Patient compliance in this regard is variable to non-adherence so must be encouraged repeatedly.